Fig. 7
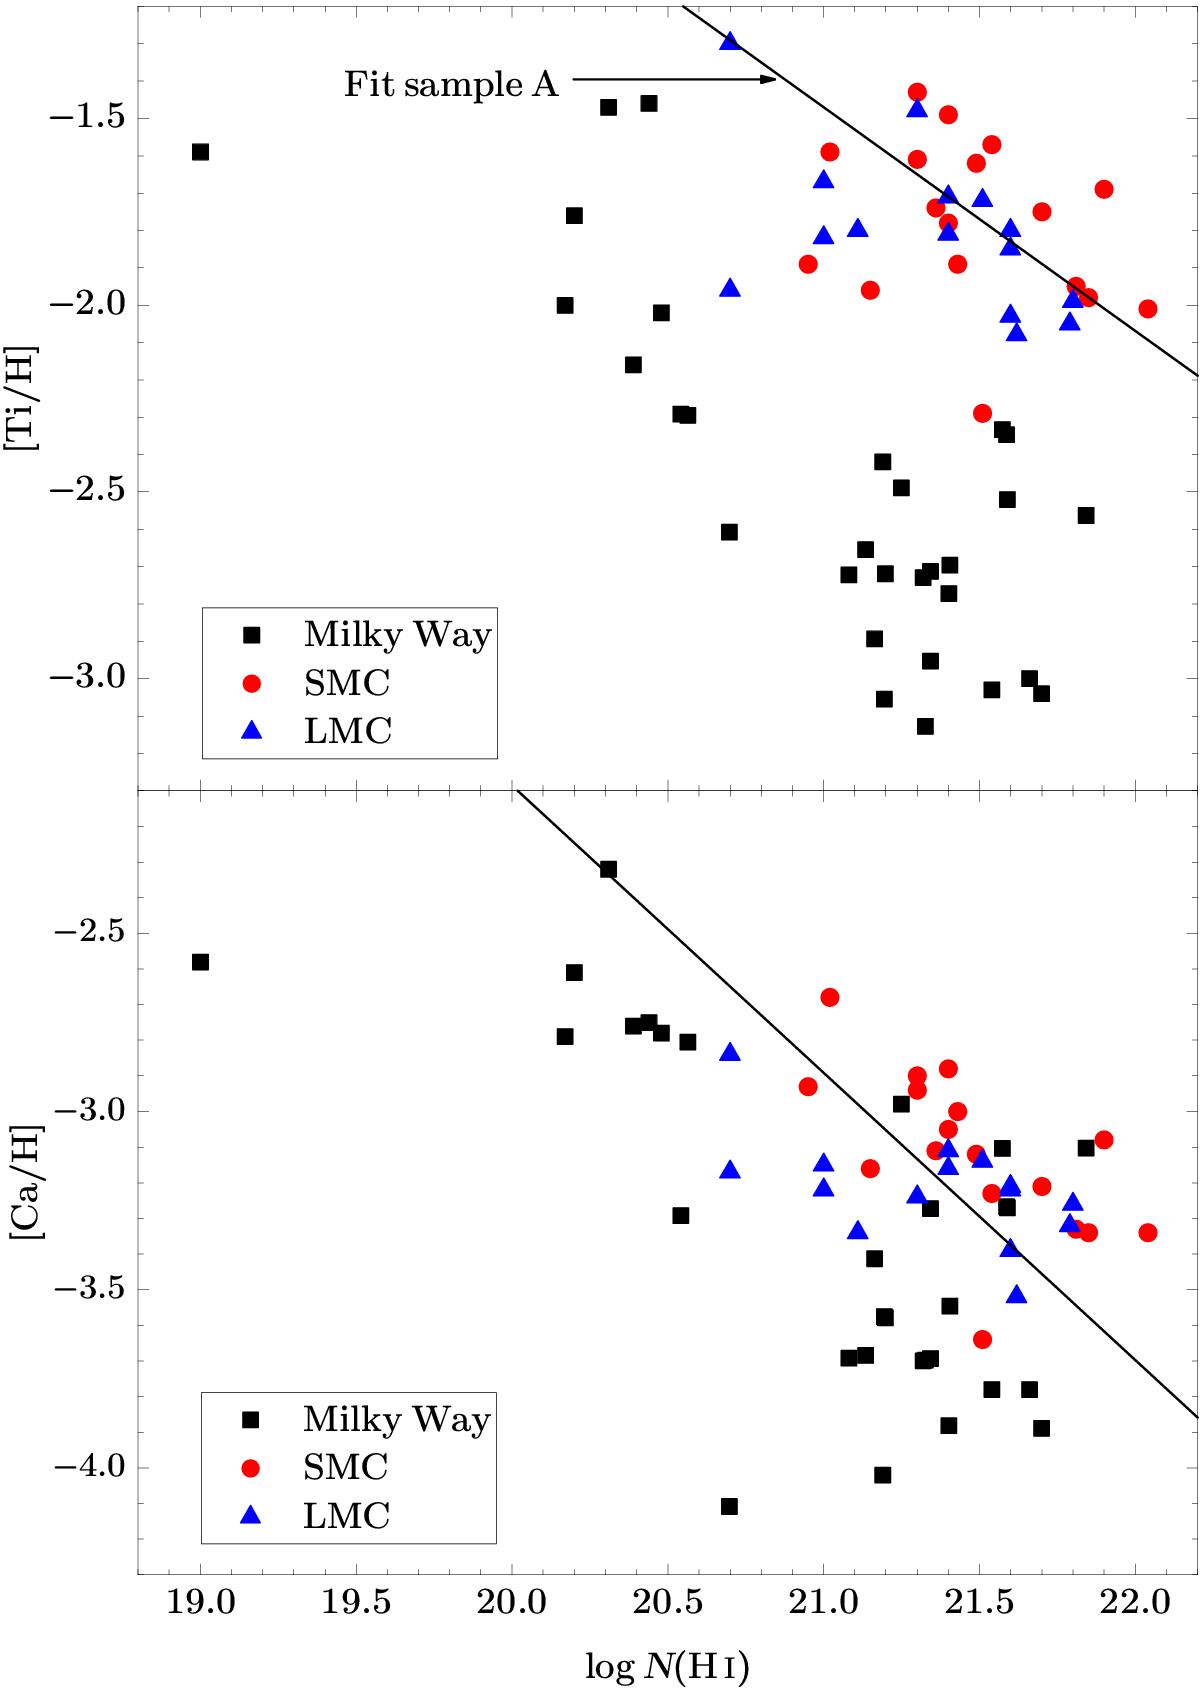
[Ti/H] and [Ca/H] vs. log N(H i) of absorption line systems in the Milky Way and the Small & Large Magellanic Clouds (SMC and LMC, respectively). In case of [Ti/H] the solid line represents the linear fit of the sample A systems, which in this case are class 1 systems, too. In case of [Ca/H] the solid line represents the linear fit of all the QALS for which Ca ii as well as H i column densities are available.
Current usage metrics show cumulative count of Article Views (full-text article views including HTML views, PDF and ePub downloads, according to the available data) and Abstracts Views on Vision4Press platform.
Data correspond to usage on the plateform after 2015. The current usage metrics is available 48-96 hours after online publication and is updated daily on week days.
Initial download of the metrics may take a while.