Fig. 5
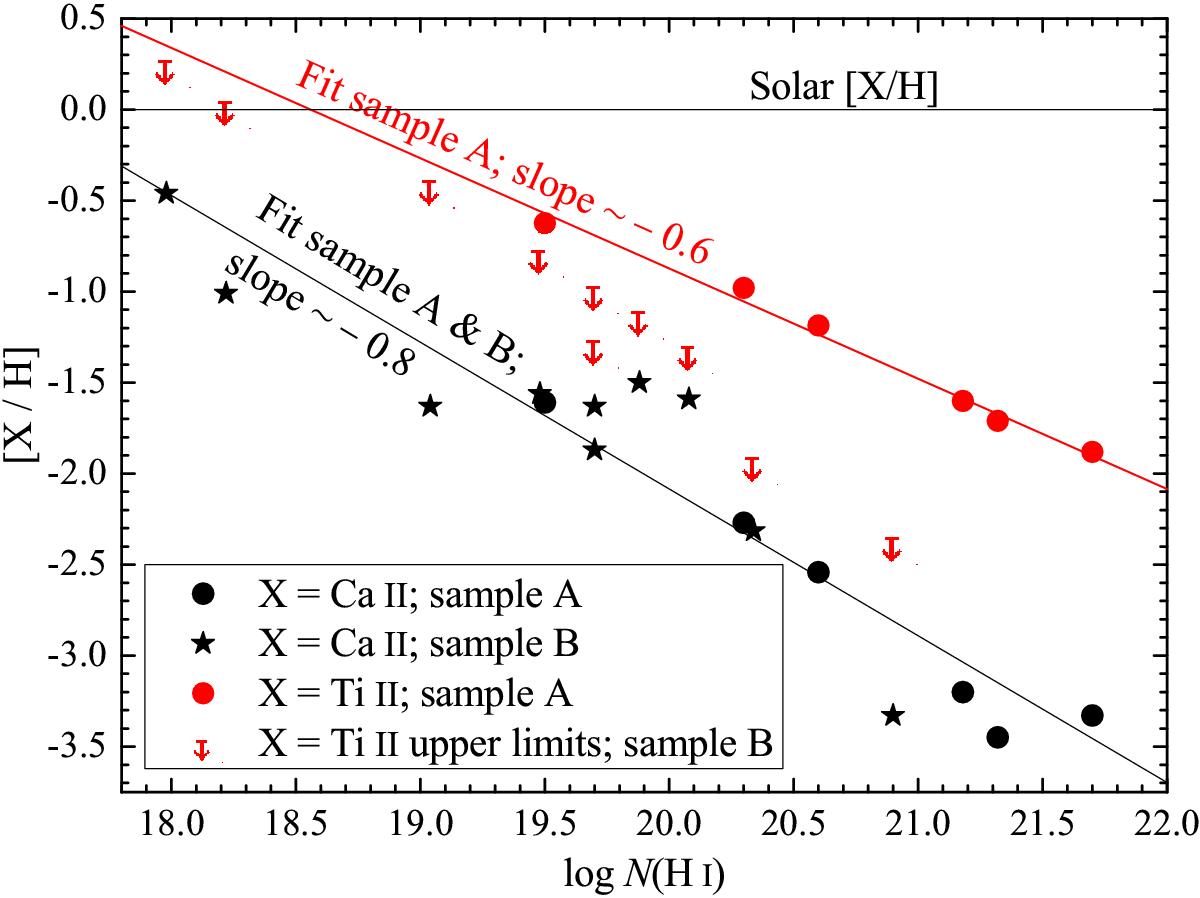
[Ca/H] and [Ti/H] vs. log N(H i). In case of Ti ii the solid line represents the linear fit of the sample A systems, which in this case are all class 1 systems, too. In case of Ca ii the solid line represents the linear fit of all systems with known N(Ca ii). Systems with solar Ca/H or Ti/H ratios would lay on the horizontal solid line with [X/H] = 0.
Current usage metrics show cumulative count of Article Views (full-text article views including HTML views, PDF and ePub downloads, according to the available data) and Abstracts Views on Vision4Press platform.
Data correspond to usage on the plateform after 2015. The current usage metrics is available 48-96 hours after online publication and is updated daily on week days.
Initial download of the metrics may take a while.