Fig. 2
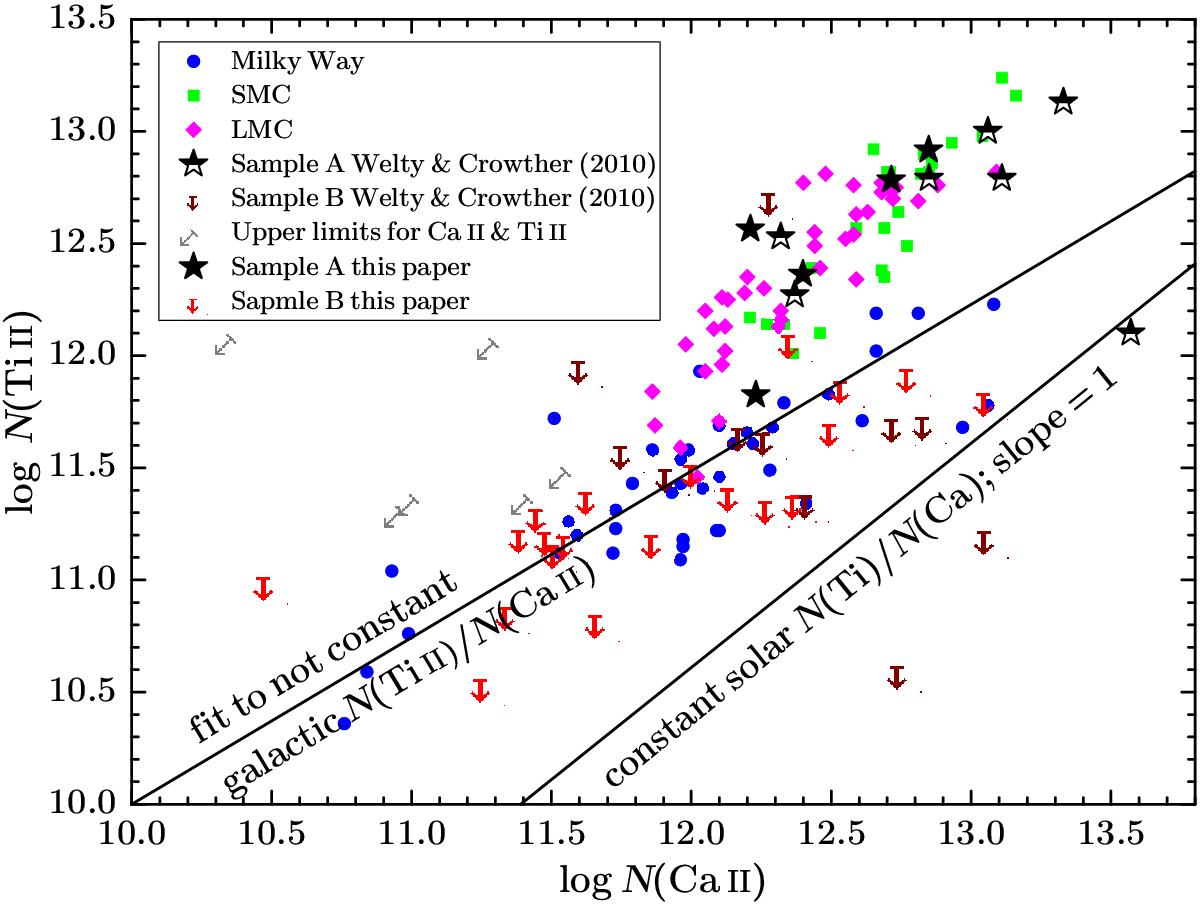
log [N(Ti ii)] vs. log [N(Ca ii)] for QALS for which Ca ii and Ti ii column densities (sample A) or upper limits therefore (sample B) are available. ALS in the Magellanic Clouds as well as in the Milky Way are shown, too. With the one exception showing a solar like Ti/Ca-ratio all the sample A systems have supersolar Ti/Ca-ratios. Systems with constant, solar Ti/Ca-ratio would lay on the black line with slope 1. The other black line represents the linear fit of the Galactic ALS already published by Welty & Crowther (2010). Its slope <1 indicates decreasing Ti/Ca-ratio with increasing Ca ii-column density.
Current usage metrics show cumulative count of Article Views (full-text article views including HTML views, PDF and ePub downloads, according to the available data) and Abstracts Views on Vision4Press platform.
Data correspond to usage on the plateform after 2015. The current usage metrics is available 48-96 hours after online publication and is updated daily on week days.
Initial download of the metrics may take a while.