Free Access
Fig. 3
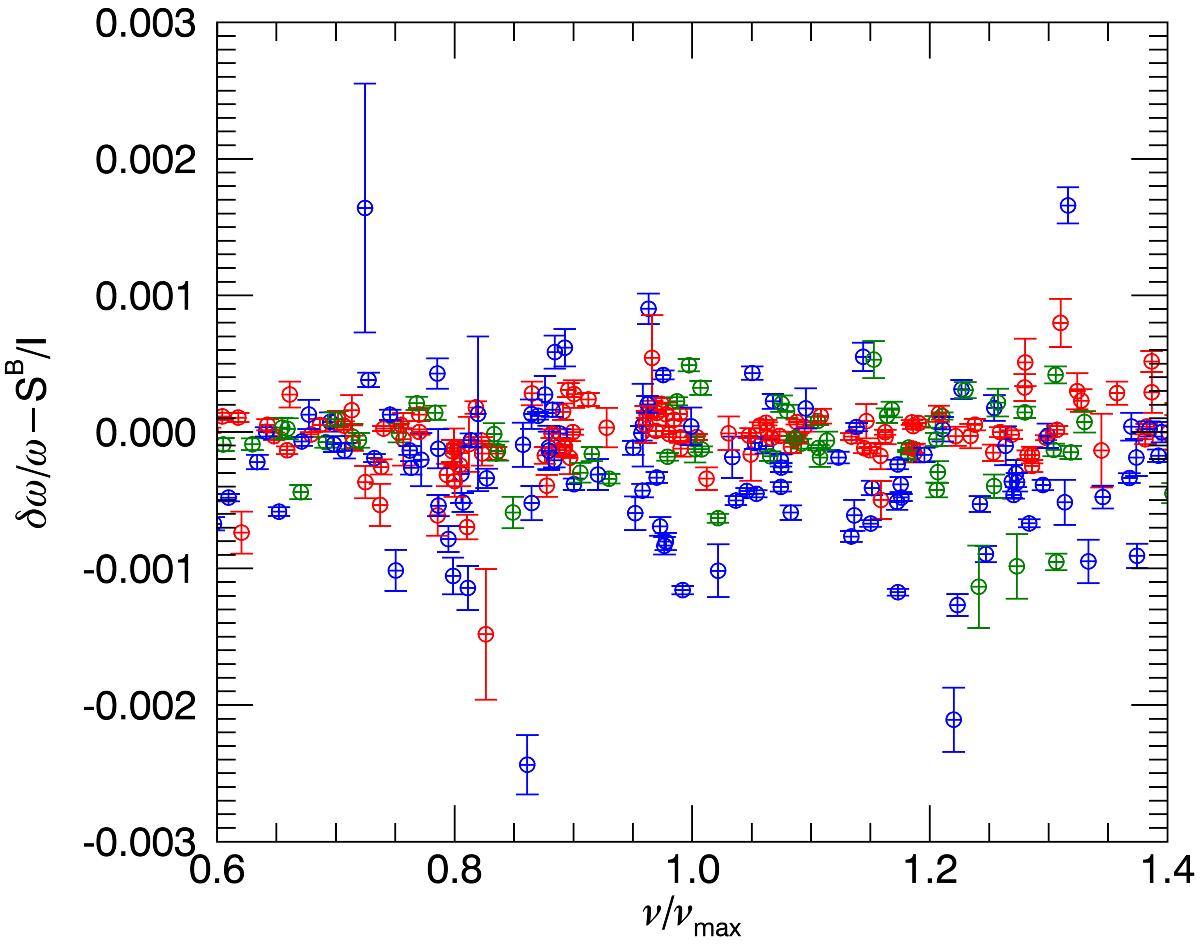
Frequency differences between the observations and the best models after subtracting the surface effects. Red points are for ℓ = 0, blue points for ℓ = 2 and green points for ℓ = 3. All nineteen stars are included.
Current usage metrics show cumulative count of Article Views (full-text article views including HTML views, PDF and ePub downloads, according to the available data) and Abstracts Views on Vision4Press platform.
Data correspond to usage on the plateform after 2015. The current usage metrics is available 48-96 hours after online publication and is updated daily on week days.
Initial download of the metrics may take a while.