Fig. 10
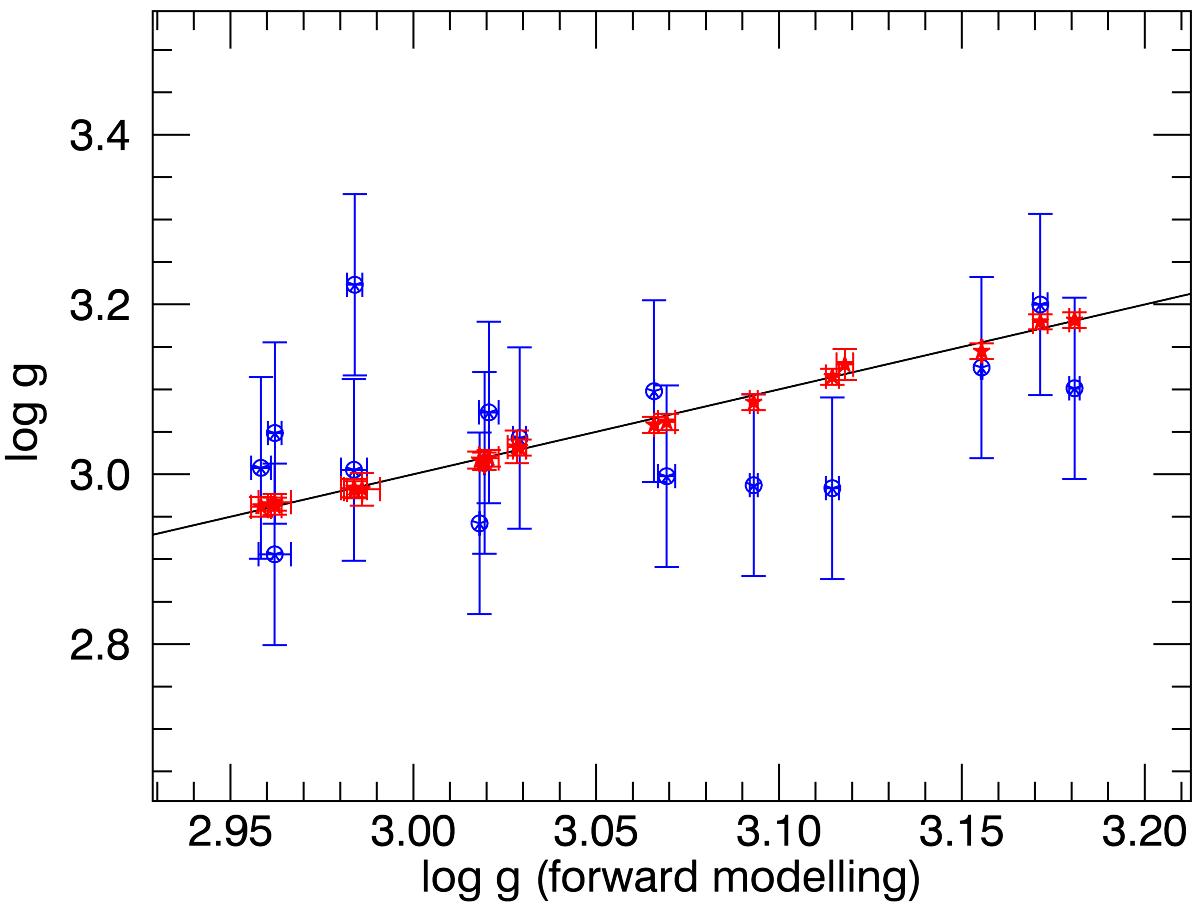
Values of log g obtained in this work plotted against observed values. The blue points correspond to the spectroscopic values and were used in the minimization procedure while the vertical coordinate of the red points was obtained by using the observed values of νmax and Teff, assuming a relationship ![]() . The observed values of νmax were not used in the minimization procedure. The continuous black line corresponds to x = y.
. The observed values of νmax were not used in the minimization procedure. The continuous black line corresponds to x = y.
Current usage metrics show cumulative count of Article Views (full-text article views including HTML views, PDF and ePub downloads, according to the available data) and Abstracts Views on Vision4Press platform.
Data correspond to usage on the plateform after 2015. The current usage metrics is available 48-96 hours after online publication and is updated daily on week days.
Initial download of the metrics may take a while.