Fig. 10
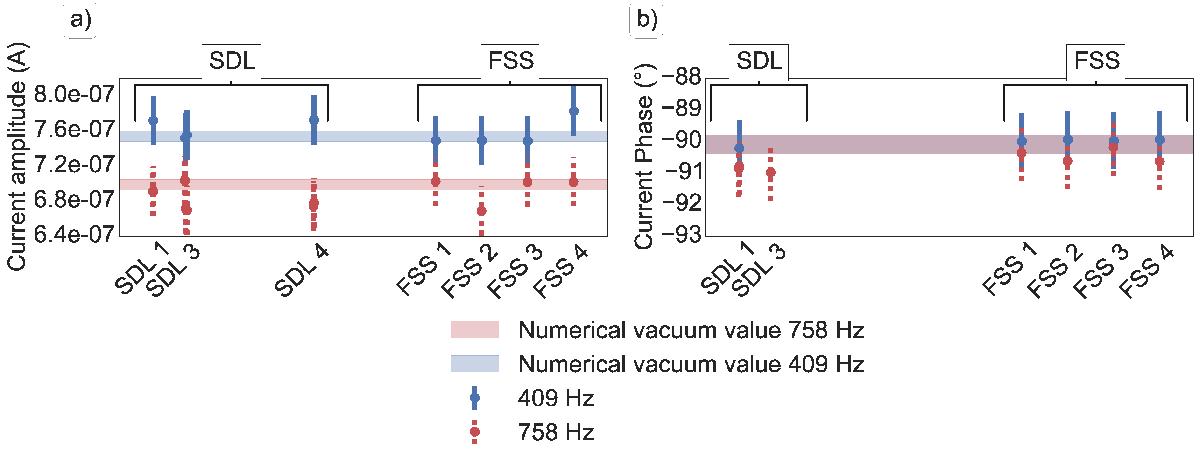
Dots with error bars represent the amplitude a) and phase b) of the currents measured during SDL and FSS phases at 409 Hz and 758 Hz. The phase of the currents measured during SDL 4 could not be retrieved because of disturbances in the signal. The blue (resp., red) shaded lines indicates the expected amplitude of the current and phases at 409 Hz (resp., 758 Hz) in a vacuum derived from numerical simulations and the associated error due to the mesh approximation. The potential difference used to generate the current at 758 Hz is half that used at 409 Hz
Current usage metrics show cumulative count of Article Views (full-text article views including HTML views, PDF and ePub downloads, according to the available data) and Abstracts Views on Vision4Press platform.
Data correspond to usage on the plateform after 2015. The current usage metrics is available 48-96 hours after online publication and is updated daily on week days.
Initial download of the metrics may take a while.