Fig. 7
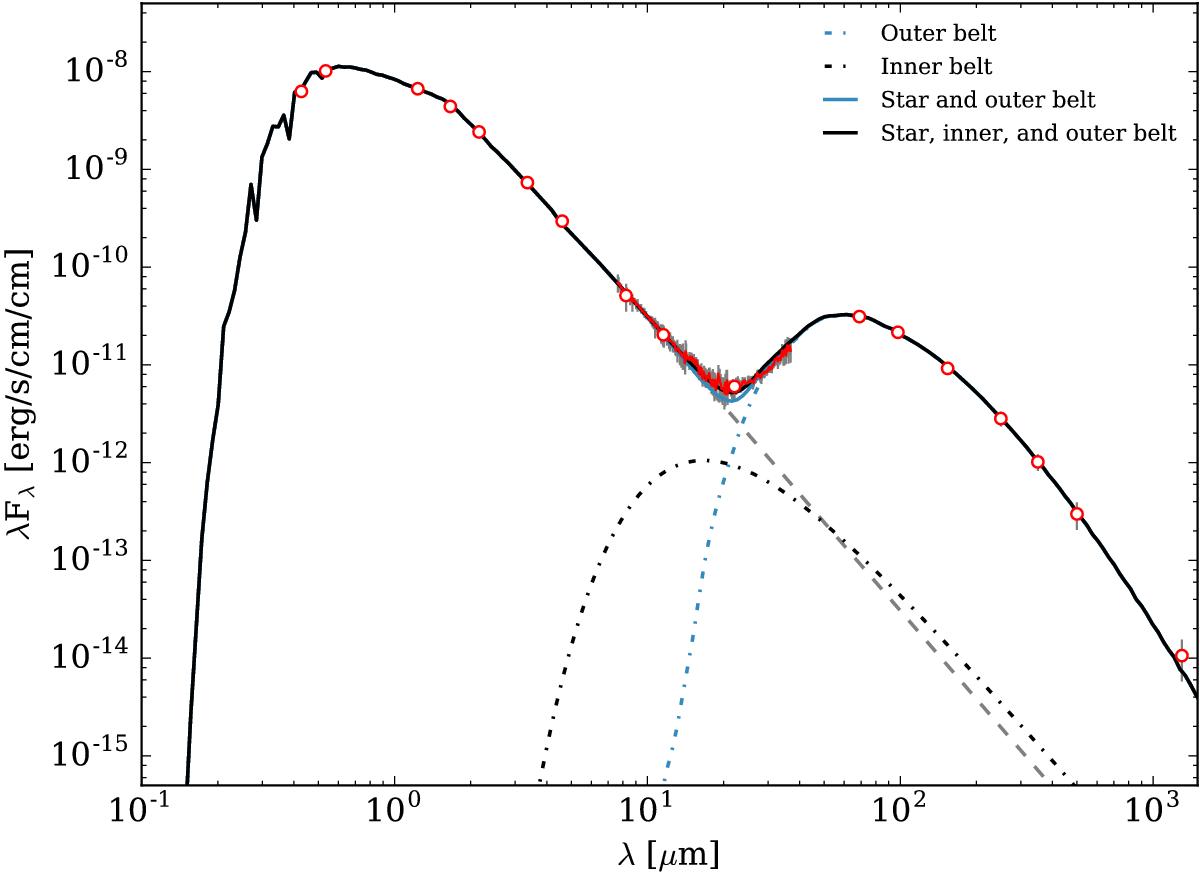
Spectral energy distribution of HD 61005. Photometric measurements are shown in red, along with the Spitzer/IRS spectrum (uncertainties, shown in gray, are 3σ, most of them being smaller than the symbol). The dashed gray line is the photospheric model, the black and cyan lines are the best fit models (including the stellar contribution, but with and without the inner component, see text for details).
Current usage metrics show cumulative count of Article Views (full-text article views including HTML views, PDF and ePub downloads, according to the available data) and Abstracts Views on Vision4Press platform.
Data correspond to usage on the plateform after 2015. The current usage metrics is available 48-96 hours after online publication and is updated daily on week days.
Initial download of the metrics may take a while.