Fig. 4
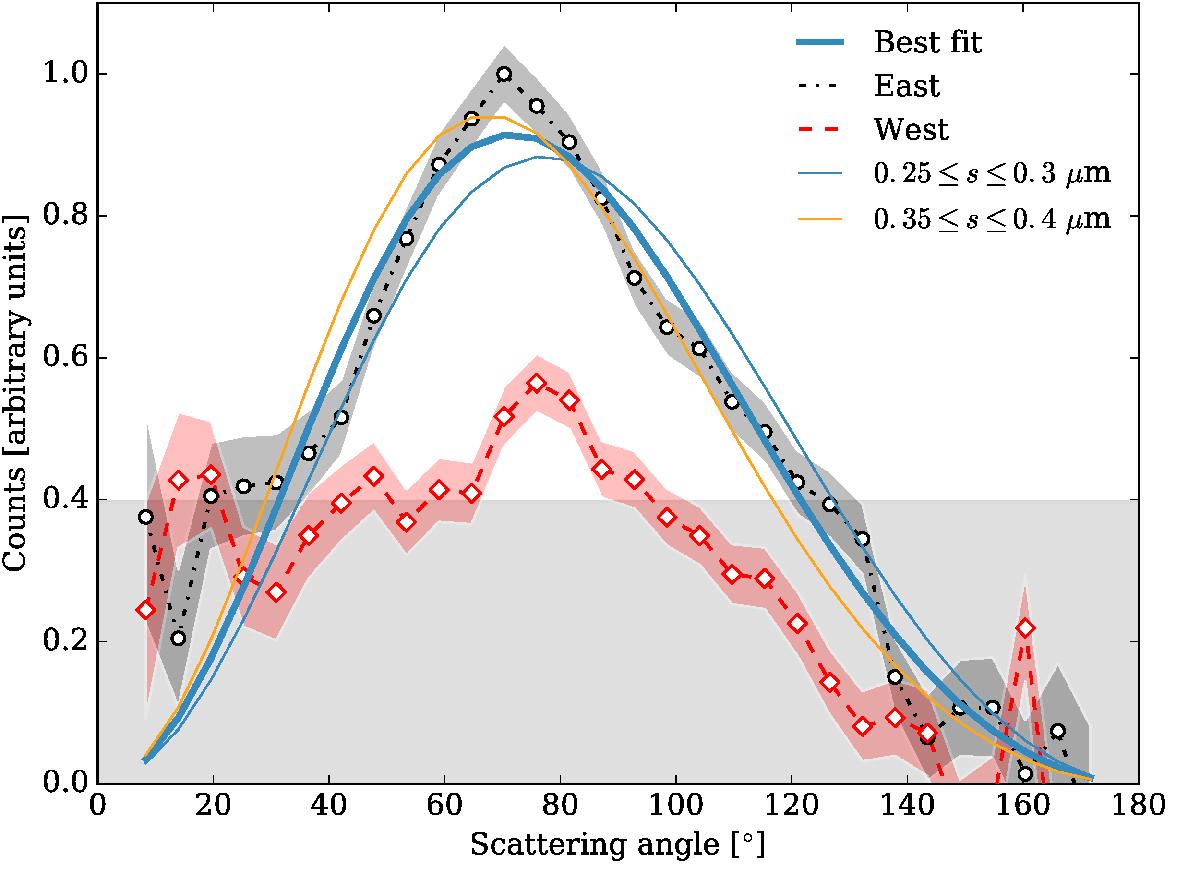
Azimuthal dependency of the polarized intensity in the DPI H-band observations, in black and red for the East and West sides, respectively. The shaded curves are representative of the uncertainties estimated from the noise map and the shaded gray area denotes low S/N regions estimated from the S/N map in Fig. 1. The thin solid lines display examples for different grain sizes for the same dust composition as the best fit.
Current usage metrics show cumulative count of Article Views (full-text article views including HTML views, PDF and ePub downloads, according to the available data) and Abstracts Views on Vision4Press platform.
Data correspond to usage on the plateform after 2015. The current usage metrics is available 48-96 hours after online publication and is updated daily on week days.
Initial download of the metrics may take a while.