Fig. 2
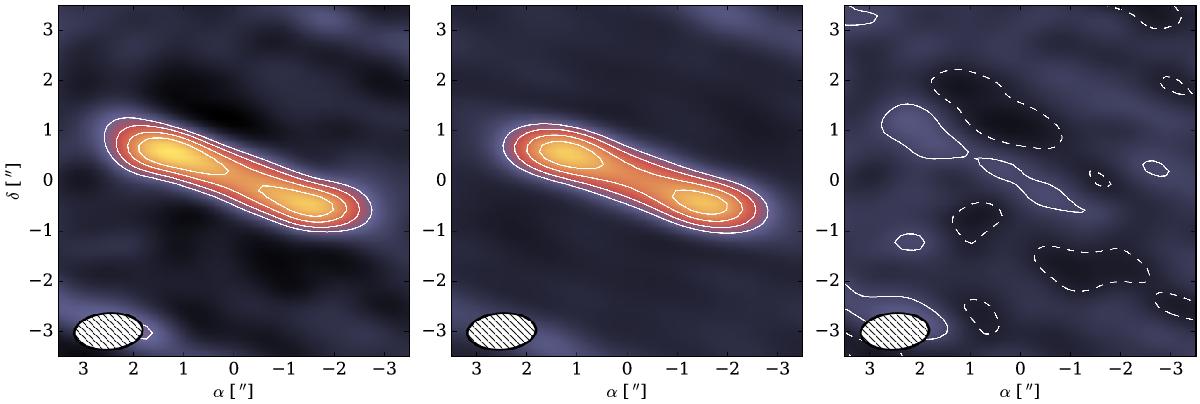
From left to right: observations, best-fit model and residuals of the ALMA data. For all panels the color map is a linear stretch between −0.27 and 1.23 mJy/beam. The standard deviation estimated in an empty region of the observations is of 0.09 mJy/beam. For both the observations and the model the contours are set at [3, 5, 7.5, 10]σ, and [−σ, σ] for the residuals (no residuals beyond the 2σ level). The beam size is shown in the lower left corner of each panels.
Current usage metrics show cumulative count of Article Views (full-text article views including HTML views, PDF and ePub downloads, according to the available data) and Abstracts Views on Vision4Press platform.
Data correspond to usage on the plateform after 2015. The current usage metrics is available 48-96 hours after online publication and is updated daily on week days.
Initial download of the metrics may take a while.