Free Access
Fig. B.2
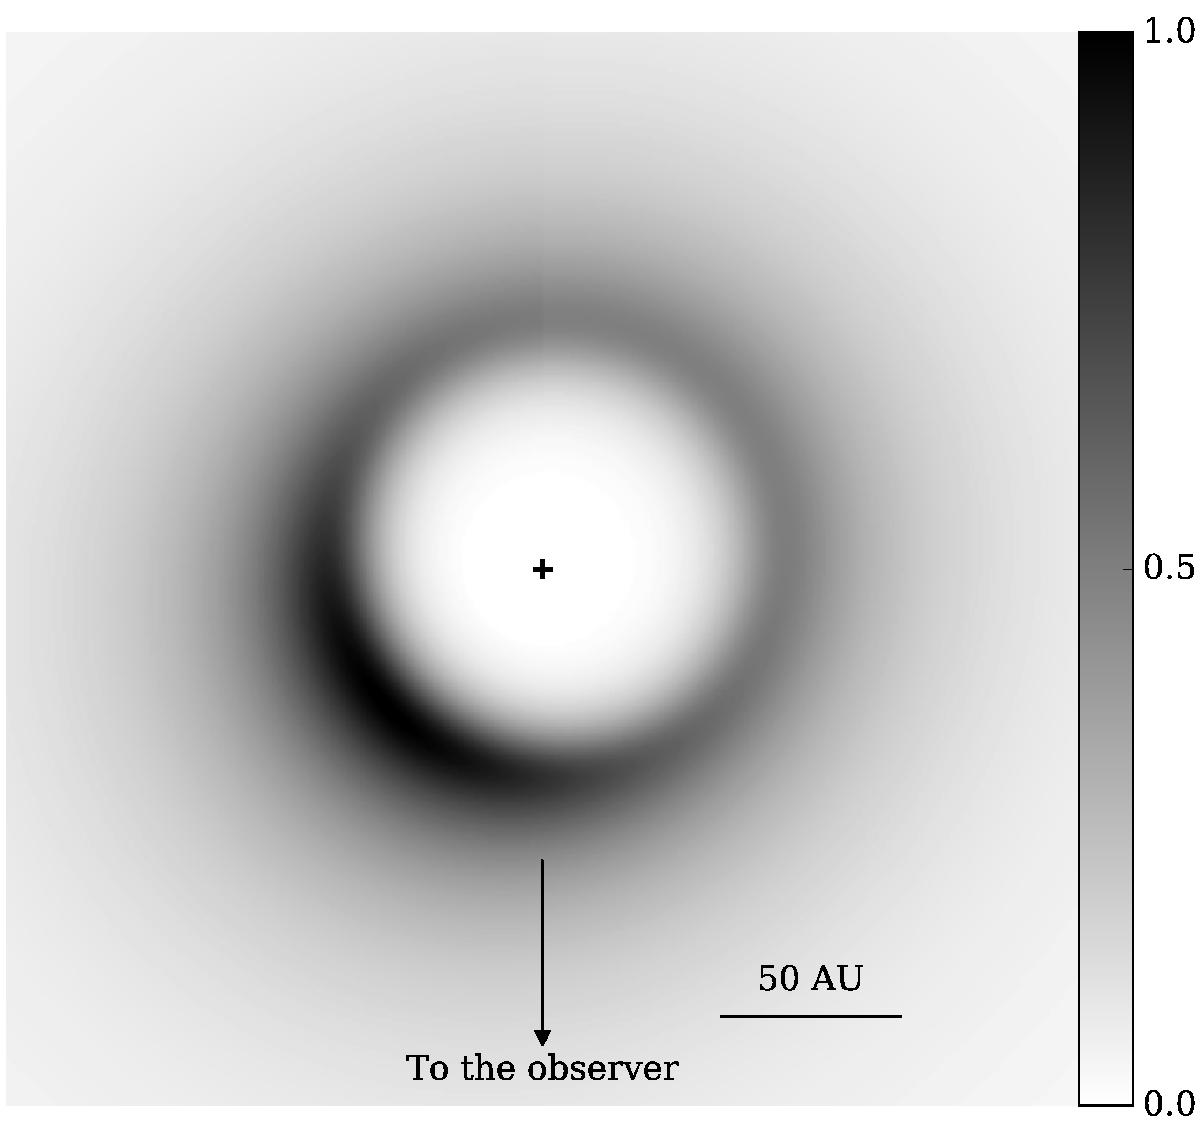
Top view of the dust density distribution (normalized to its maximum) for the best-fit model to the SPHERE observations. The direction to the observer is indicated by the arrow and the spatial scale in the lower right corner.
Current usage metrics show cumulative count of Article Views (full-text article views including HTML views, PDF and ePub downloads, according to the available data) and Abstracts Views on Vision4Press platform.
Data correspond to usage on the plateform after 2015. The current usage metrics is available 48-96 hours after online publication and is updated daily on week days.
Initial download of the metrics may take a while.