Fig. 1
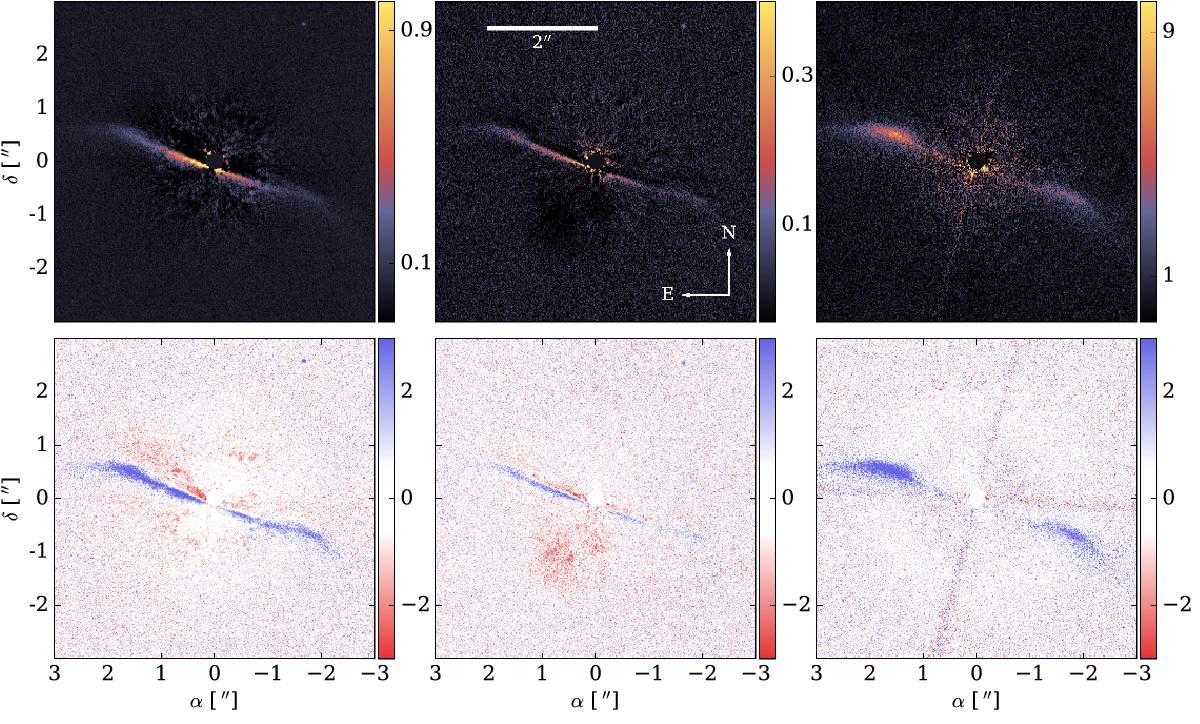
Reduced SPHERE observations of HD 61005 used in the analysis. North is up, East is left. From left to right; IRDIS ADI in H and K-bands (PCA with 6 components), and IRDIS DPI Qφ in H-band. Top row shows the data in linear stretch, with a central mask of 0.15′′, and the bottom row shows estimated signal-to-noise maps (see text for detail), with a stretch between [−3σ, 3σ].
Current usage metrics show cumulative count of Article Views (full-text article views including HTML views, PDF and ePub downloads, according to the available data) and Abstracts Views on Vision4Press platform.
Data correspond to usage on the plateform after 2015. The current usage metrics is available 48-96 hours after online publication and is updated daily on week days.
Initial download of the metrics may take a while.