Fig. 4
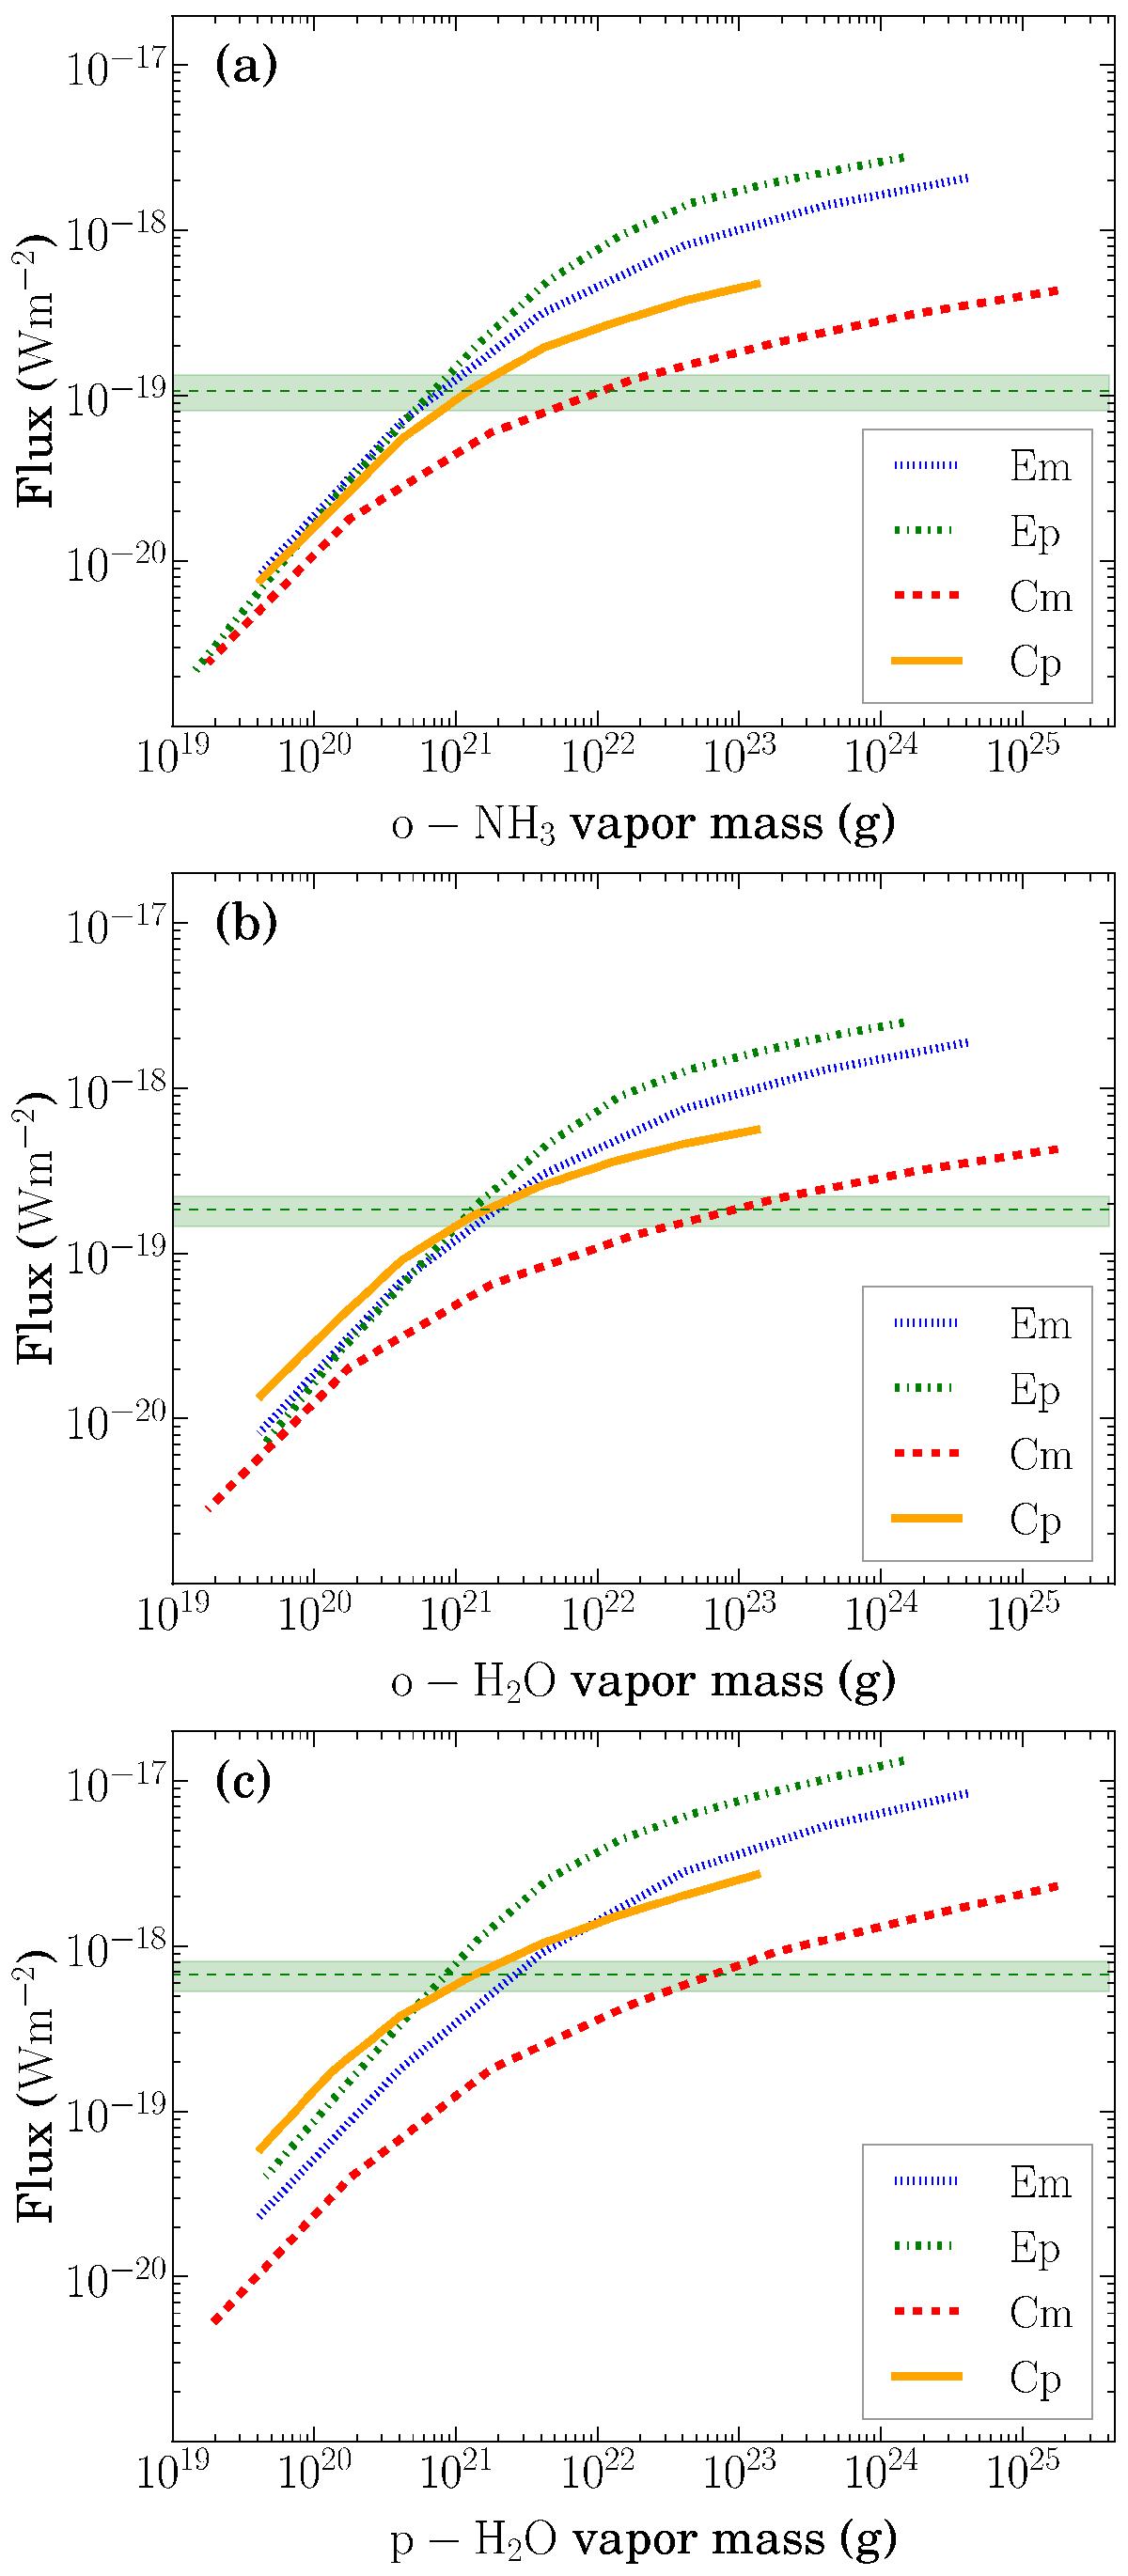
Panels a), b) and c) show the LIME (Brinch & Hogerheijde 2010) output of the total line fluxes of ortho-NH3, ortho-H2O, and para-H2O, respectively, as a function of the total water vapor mass. The blue, green, red, and yellow curves correspond to the Em, Ep, Cm, and Cp models, respectively. The dashed lines and horizontal green bar show the observed line fluxes and their 3σ ranges, with sigma having two sources of noise added in quadrature; the systematic error of the observations, estimated to be about 20% of the total flux, and the rms of the spectra.
Current usage metrics show cumulative count of Article Views (full-text article views including HTML views, PDF and ePub downloads, according to the available data) and Abstracts Views on Vision4Press platform.
Data correspond to usage on the plateform after 2015. The current usage metrics is available 48-96 hours after online publication and is updated daily on week days.
Initial download of the metrics may take a while.