Fig. 1
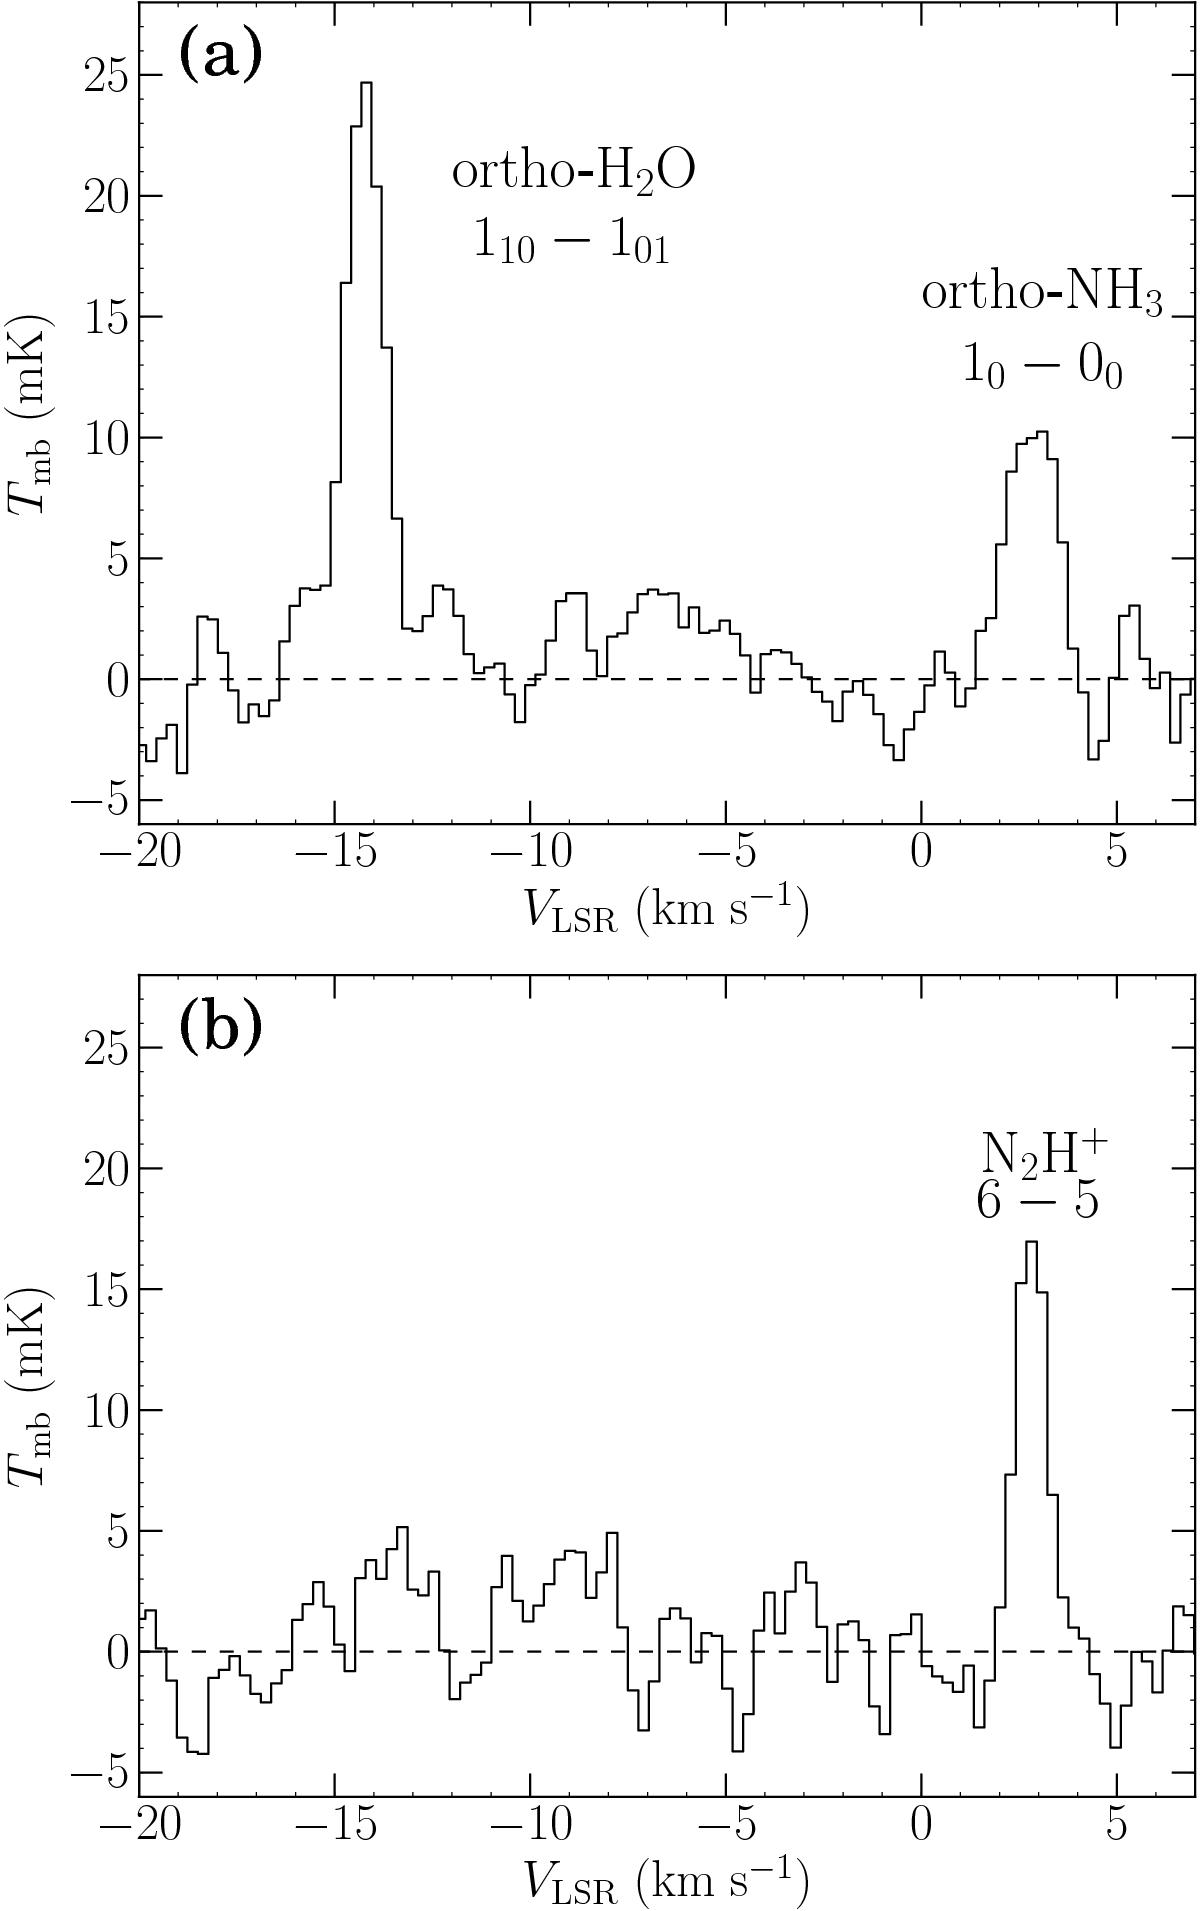
Observed spectra of a) ortho-NH310−00, ortho-H2O 110−101 (previously presented by H11); and b) N2H+ 6–5, using Herschel WBS. The dashed line shows the continuum-subtracted spectral baseline. The o-H2O and o-NH3 lines are observed in opposite sidebands, causing the o-H2O to be detected at a velocity of −14 km s-1 in panel a).
Current usage metrics show cumulative count of Article Views (full-text article views including HTML views, PDF and ePub downloads, according to the available data) and Abstracts Views on Vision4Press platform.
Data correspond to usage on the plateform after 2015. The current usage metrics is available 48-96 hours after online publication and is updated daily on week days.
Initial download of the metrics may take a while.