Free Access
Fig. 9
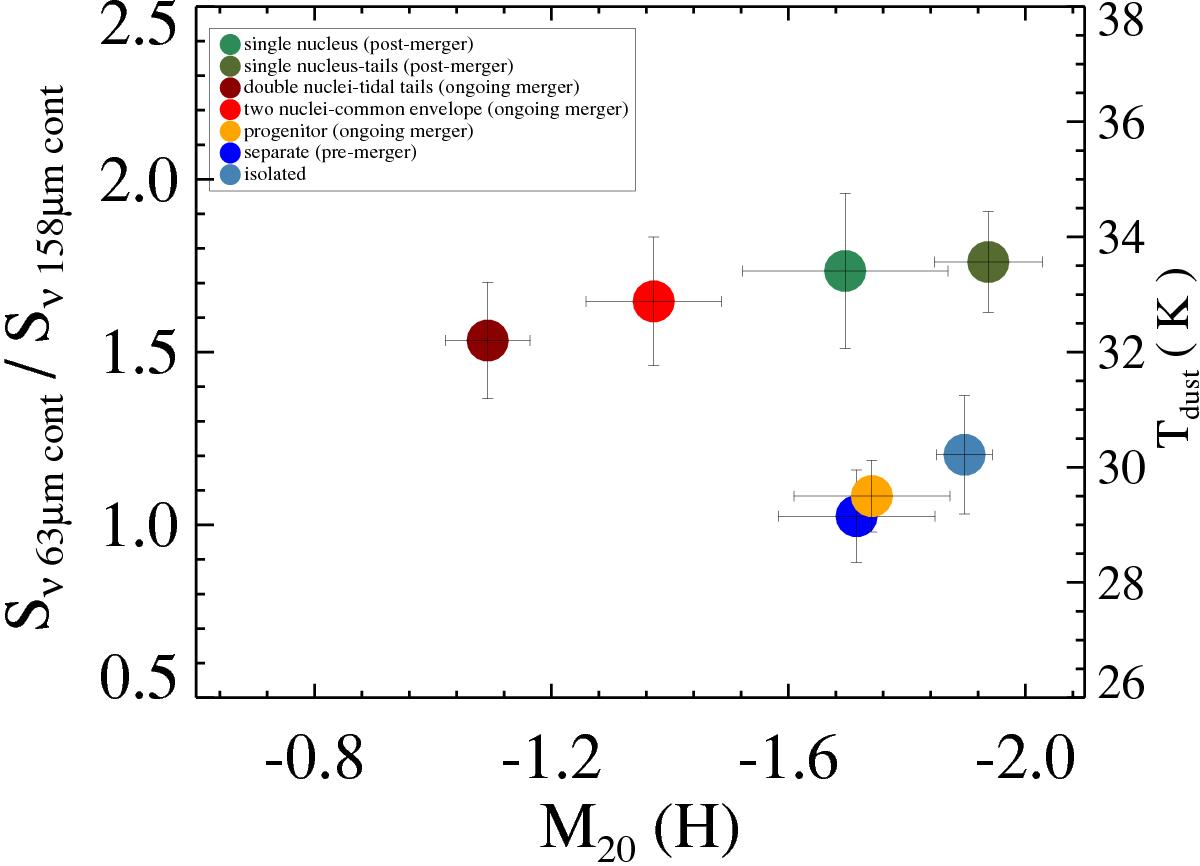
M20 values calculated in the H-band, along with the corresponding Herschel FIR flux density ratios and the estimated Tdust. The sample is grouped by the H11 morphology type, also shown in Fig. 3. The error bars are the standard deviations around the mean of each group.
Current usage metrics show cumulative count of Article Views (full-text article views including HTML views, PDF and ePub downloads, according to the available data) and Abstracts Views on Vision4Press platform.
Data correspond to usage on the plateform after 2015. The current usage metrics is available 48-96 hours after online publication and is updated daily on week days.
Initial download of the metrics may take a while.