Free Access
Fig. 7
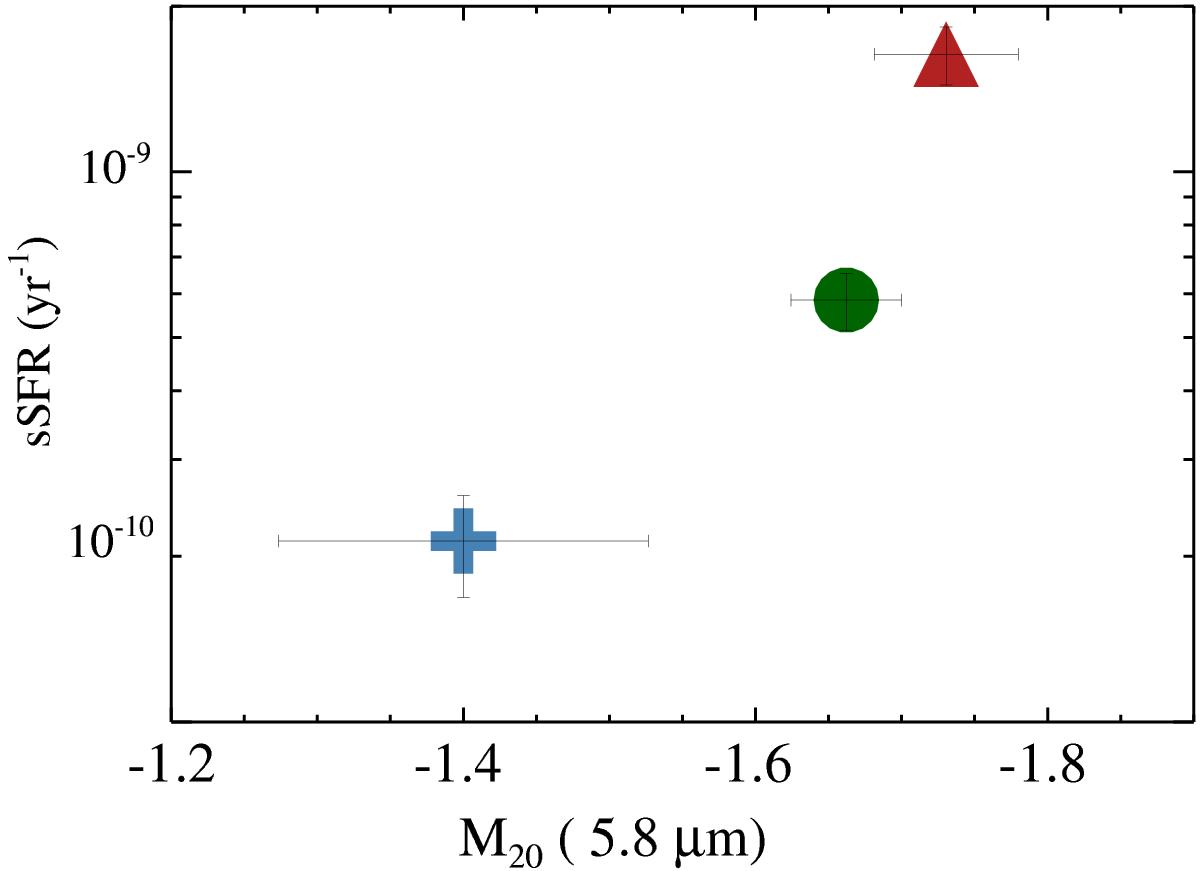
sSFR-M20 in IRAC 5.8 μm. The steel blue crosses correspond to sub-LIRGs, the green filled circles indicate LIRGs and finally the red triangles represent the ULIRGs. The error bars are the standard deviation of the mean values.
Current usage metrics show cumulative count of Article Views (full-text article views including HTML views, PDF and ePub downloads, according to the available data) and Abstracts Views on Vision4Press platform.
Data correspond to usage on the plateform after 2015. The current usage metrics is available 48-96 hours after online publication and is updated daily on week days.
Initial download of the metrics may take a while.