Fig. 6
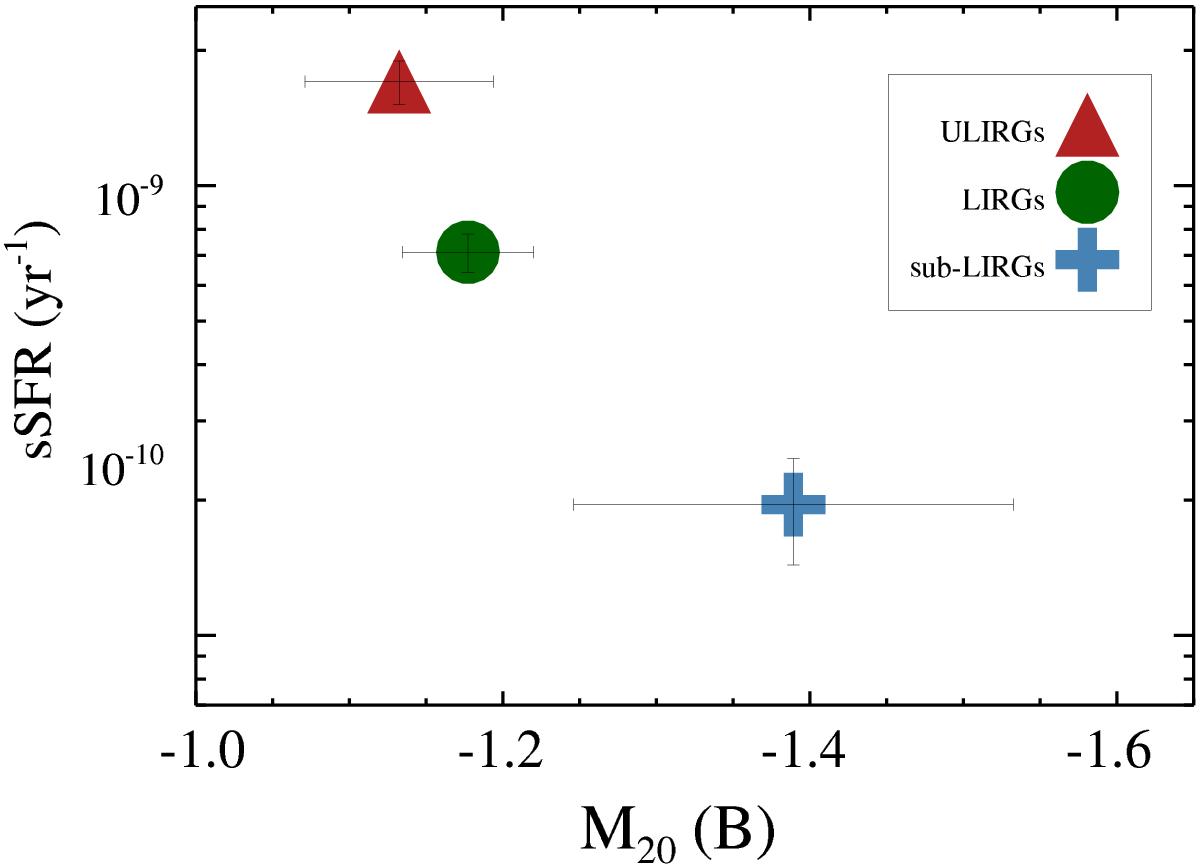
sSFR−M20 in B band. The steel blue cross corresponds to the mean value of the sub-LIRGs sample, the green filled circle indicates the mean value of LIRGs and the red triangle represents the mean value of ULIRGs. The error bars are the standard deviation of the mean values. The larger standard deviation of the sub-LIRG point is due to there being a small number of galaxies (only 8% of the whole sample) in this category.
Current usage metrics show cumulative count of Article Views (full-text article views including HTML views, PDF and ePub downloads, according to the available data) and Abstracts Views on Vision4Press platform.
Data correspond to usage on the plateform after 2015. The current usage metrics is available 48-96 hours after online publication and is updated daily on week days.
Initial download of the metrics may take a while.