Fig. 2
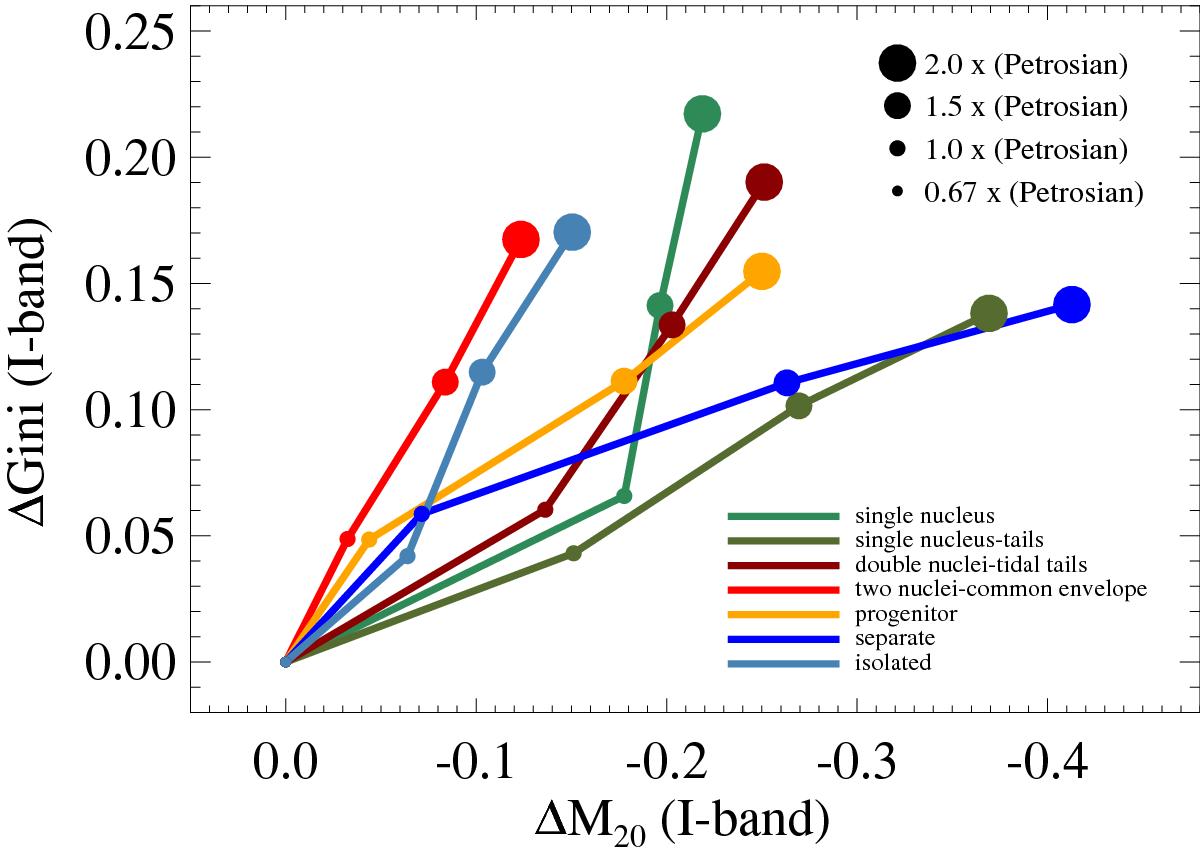
Plot presenting the change in Gini and M20 for various stages of interaction when the radius to calculate the segmentation map increases from 0.67 to 2 times the Petrosian value. ΔGini (and ΔM20) is the difference between the Gini (and M20) at a given radius, minus the value at the smallest radius. The increase in Petrosian radius is indicated by the size of the circles. The seven lines indicate the different morphological classification of LIRGs, based on morphological classification of H11. In particular, sky blue, blue, orange, red, dark red, olive, and green indicate isolated galaxies, separate galaxies (symmetric disks and no tidal tails), progenitor galaxies distinguishable with asymmetric disks or amorphous and/or tidal tails, two nuclei in common envelope, double nuclei plus tidal tail, single or obscured nucleus with long prominent tails and single or obscured nucleus with disturbed central morphology, and short faint tails.
Current usage metrics show cumulative count of Article Views (full-text article views including HTML views, PDF and ePub downloads, according to the available data) and Abstracts Views on Vision4Press platform.
Data correspond to usage on the plateform after 2015. The current usage metrics is available 48-96 hours after online publication and is updated daily on week days.
Initial download of the metrics may take a while.