Fig. 5
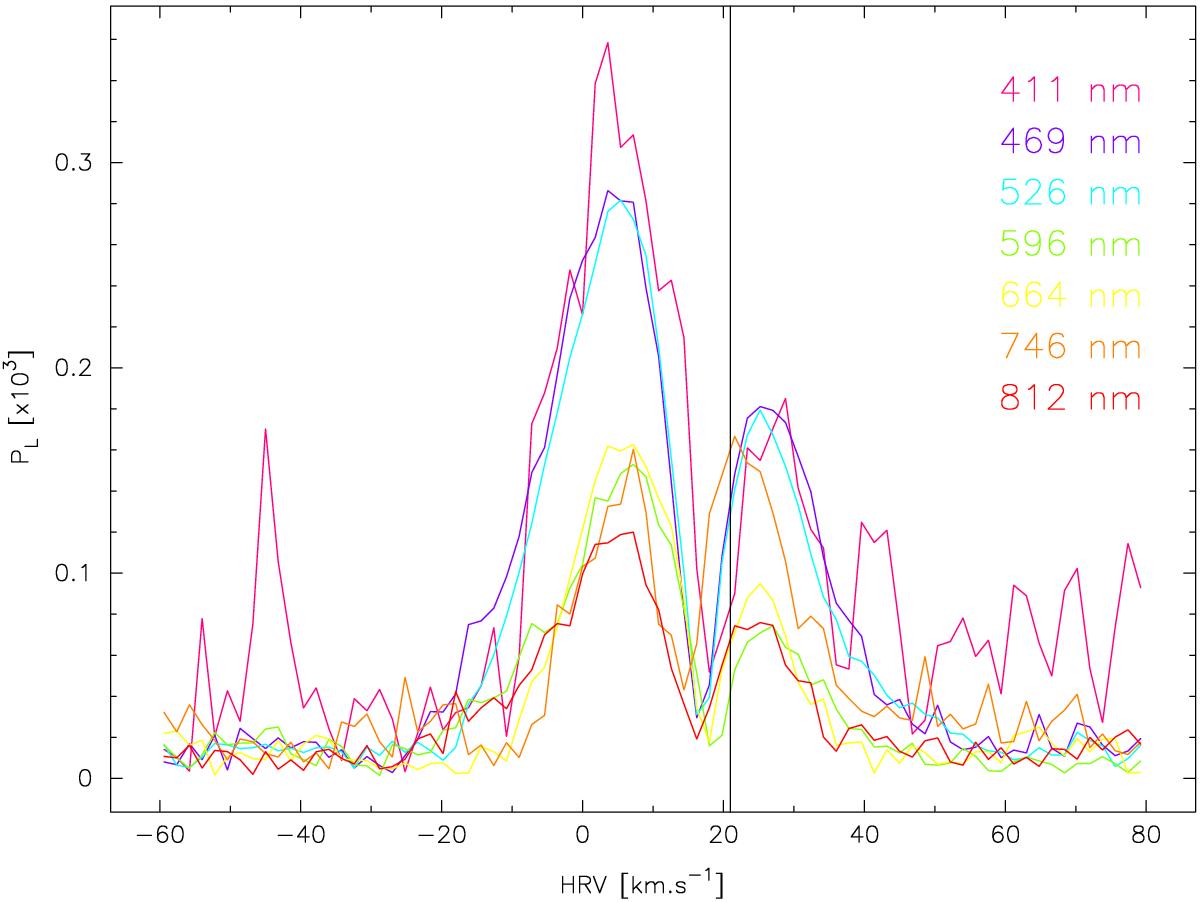
For Set 1, variations of the linear polarization of Betelgeuse PL along the LSD profiles with wavelength: different colors illustrate polarization decreasing when measured with sub-masks corresponding to the mean wavelength written on the graph (in units of nm). The vertical line corresponds to Betelgeuse’s heliocentric radial velocity.
Current usage metrics show cumulative count of Article Views (full-text article views including HTML views, PDF and ePub downloads, according to the available data) and Abstracts Views on Vision4Press platform.
Data correspond to usage on the plateform after 2015. The current usage metrics is available 48-96 hours after online publication and is updated daily on week days.
Initial download of the metrics may take a while.