Fig. 10
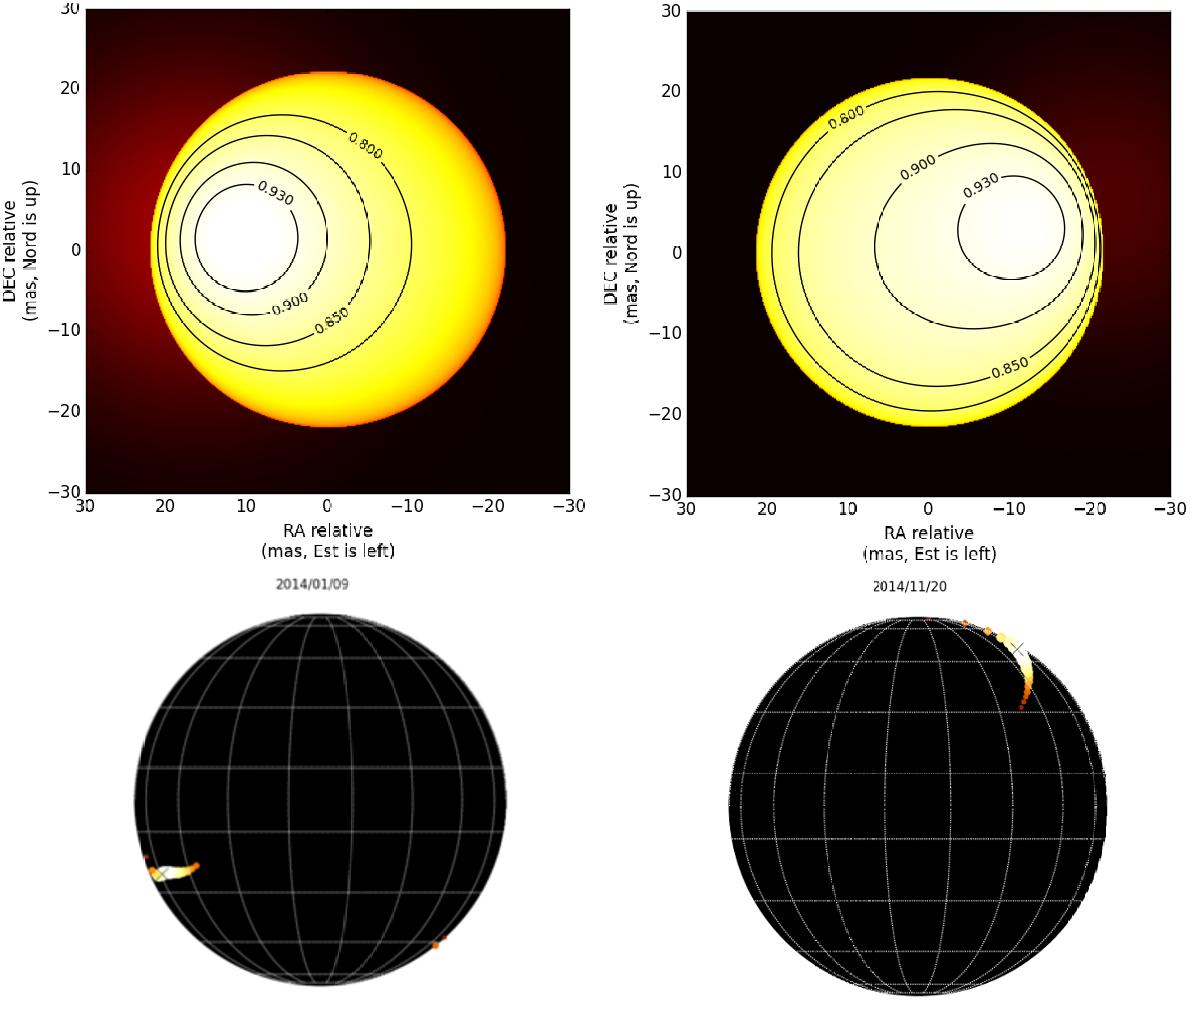
Comparison of intensity images of Betelgeuse obtained with VLTI/PIONIER (upper images, from Montargès et al. 2015) and with TBL/Narval (lower images) during the quasi-simultaneous observations of 2014: January (left) and November (right). The images from polarimetry correspond to spot1 (from Fig. 9 in January, with χ + 180° in November). North is up and east is left for all images.
Current usage metrics show cumulative count of Article Views (full-text article views including HTML views, PDF and ePub downloads, according to the available data) and Abstracts Views on Vision4Press platform.
Data correspond to usage on the plateform after 2015. The current usage metrics is available 48-96 hours after online publication and is updated daily on week days.
Initial download of the metrics may take a while.