Fig. 8
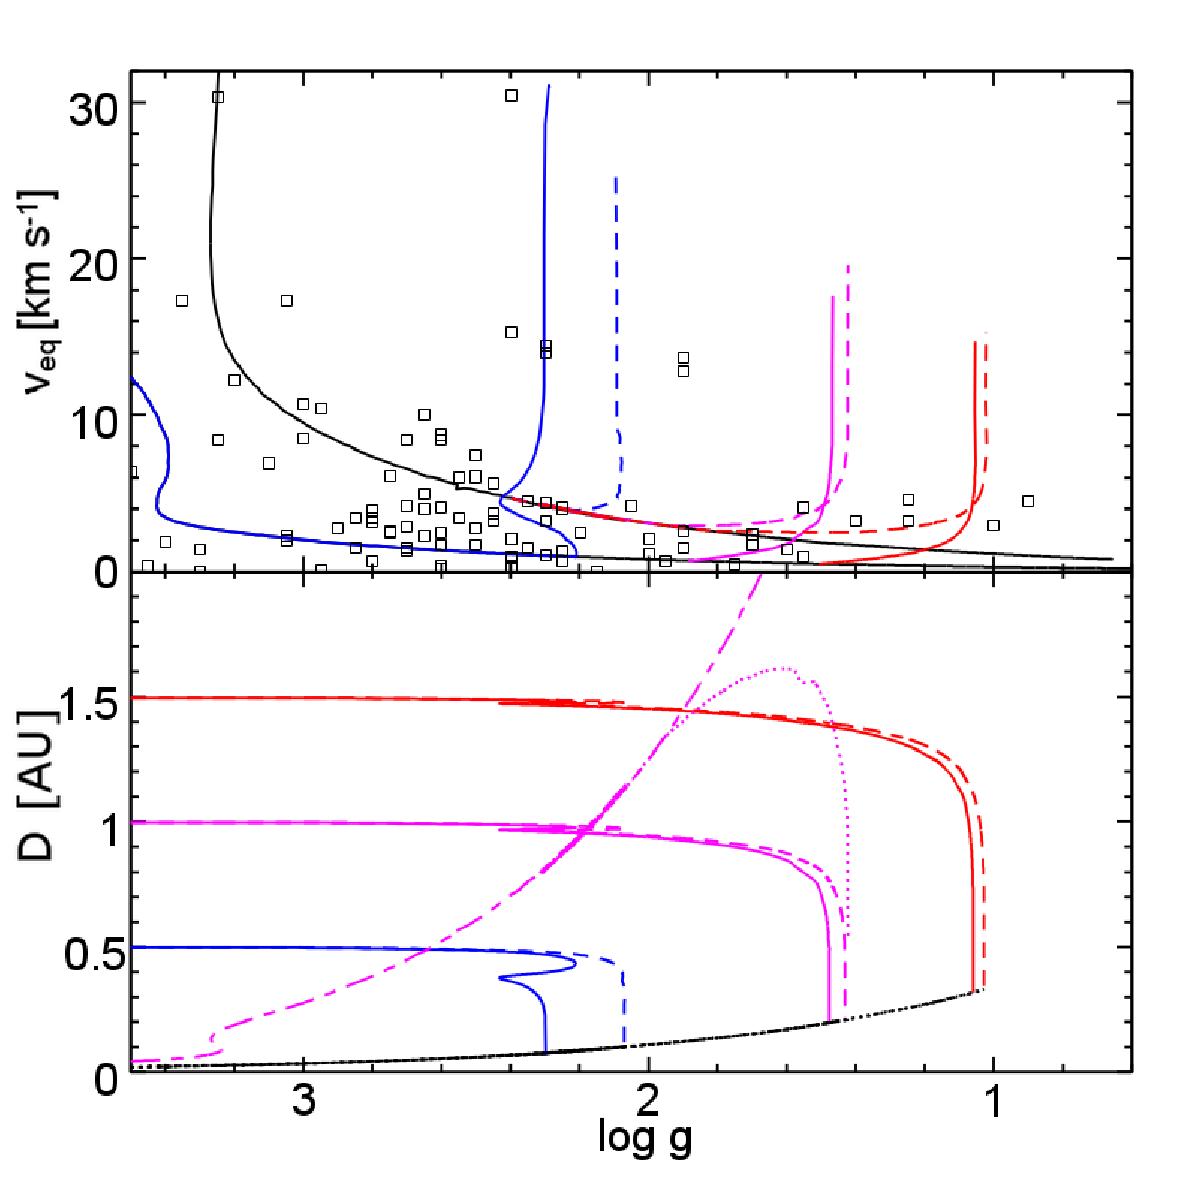
Upper panel: evolution of the surface equatorial velocity for various 2 M⊙ models with and without planets. The continuous black curves are for models without planets. The lower curve is for the models with Ωini/ Ωcrit = 0.1, the upper curve for Ωini/ Ωcrit = 0.5. The coloured curves are for models with planets. The evolution is shown only until the engulfment. The continuous (dashed) curves correspond to Ωini/ Ωcrit = 0.1 (Ωini/ Ωcrit = 0.5) models. The planets have a mass equal to 15 MJ. From left to right, we show the case for an initial distance between the star and the planet equal to 0.5, 1.0 and 1.5 au. Lower panel: evolution of the semi-major axis of the planetary orbit (coloured continuous and dashed curves) and the evolution of the stellar radii (black lower curves). The long-short dashed (magenta) curve shows the evolution of the corotation radius for the 2 M⊙ with Ωini/ Ωcrit = 0.5 without planet, the dotted line for the same model with a tidal interaction with a 15 Mj planet beginning its orbital evolution at a distance of 1 au from the star. The curve stops at engulfment.
Current usage metrics show cumulative count of Article Views (full-text article views including HTML views, PDF and ePub downloads, according to the available data) and Abstracts Views on Vision4Press platform.
Data correspond to usage on the plateform after 2015. The current usage metrics is available 48-96 hours after online publication and is updated daily on week days.
Initial download of the metrics may take a while.