Fig. 7
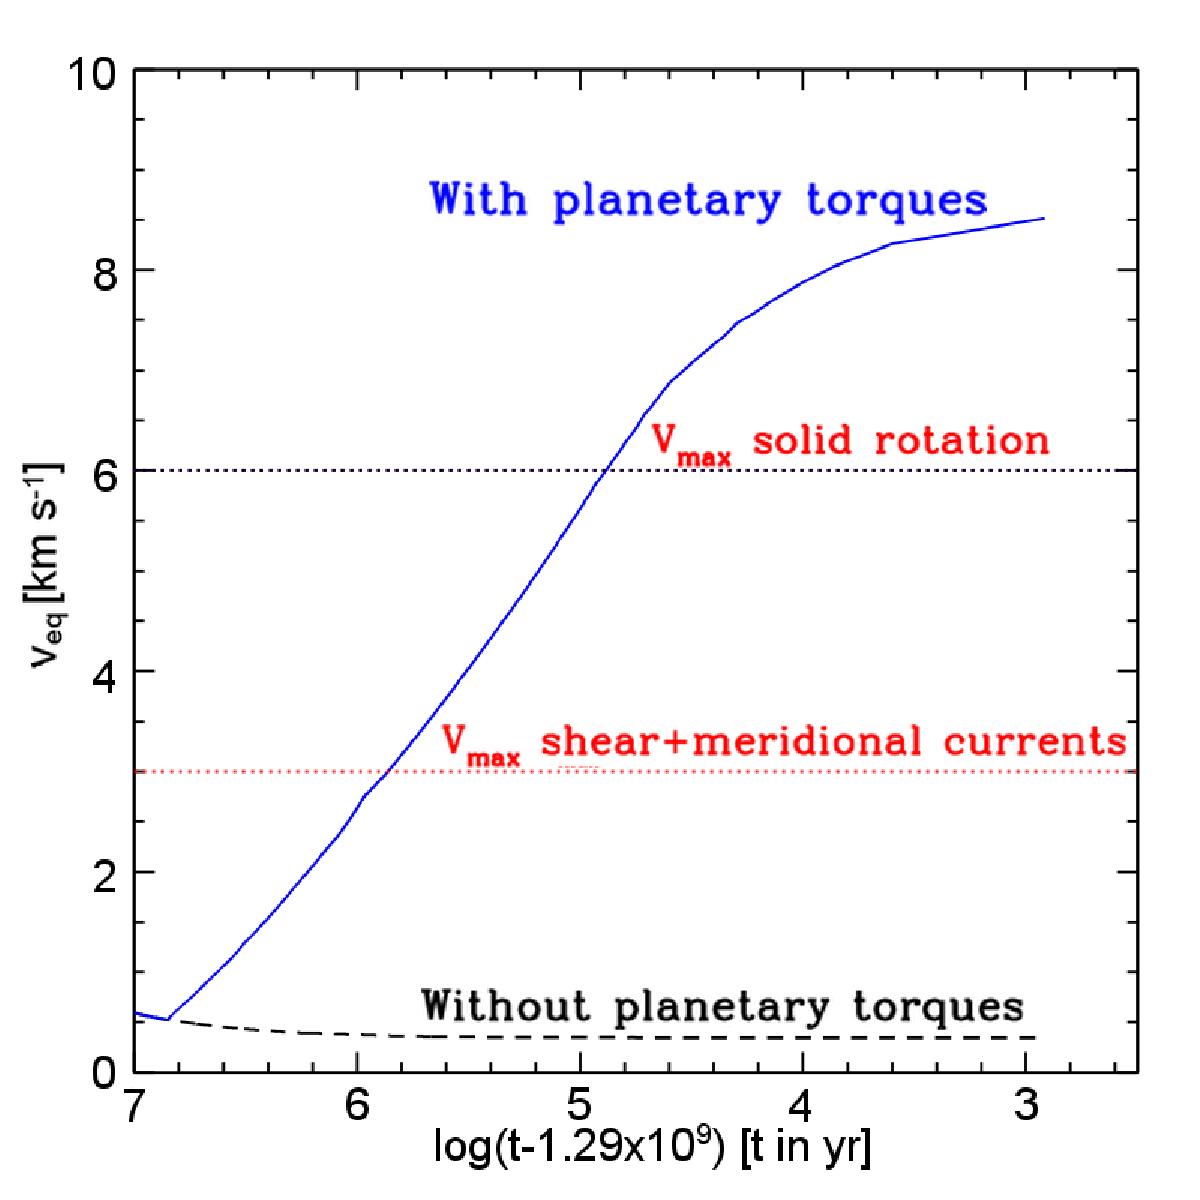
Evolution of the equatorial velocity at the surface of a 2 M⊙. The dashed line corresponds to the evolution obtained from a model with an initial surface angular velocity equal to 10% of the critical angular velocity without tidal interaction. The continuous line corresponds to the same model but accounting for the transfer of angular momentum from the planetary orbit to the star (15 MJ planet beginning to orbit at 1 au on the ZAMS). The line stops at engulfment. The two horizontal dotted lines indicate the maximum velocities that can be produced in some extreme situations from single stars at the position in the HR diagram where engulfment occurs. The lowest limit corresponds to models computed with the same physics of rotation as here but starting from a much higher initial rotation equal to about 95% the critical rotation on the ZAMS. The upper limit would correspond to a model starting with the same very high initial velocity, assuming solid-body rotation during its whole evolution.
Current usage metrics show cumulative count of Article Views (full-text article views including HTML views, PDF and ePub downloads, according to the available data) and Abstracts Views on Vision4Press platform.
Data correspond to usage on the plateform after 2015. The current usage metrics is available 48-96 hours after online publication and is updated daily on week days.
Initial download of the metrics may take a while.