Fig. 6
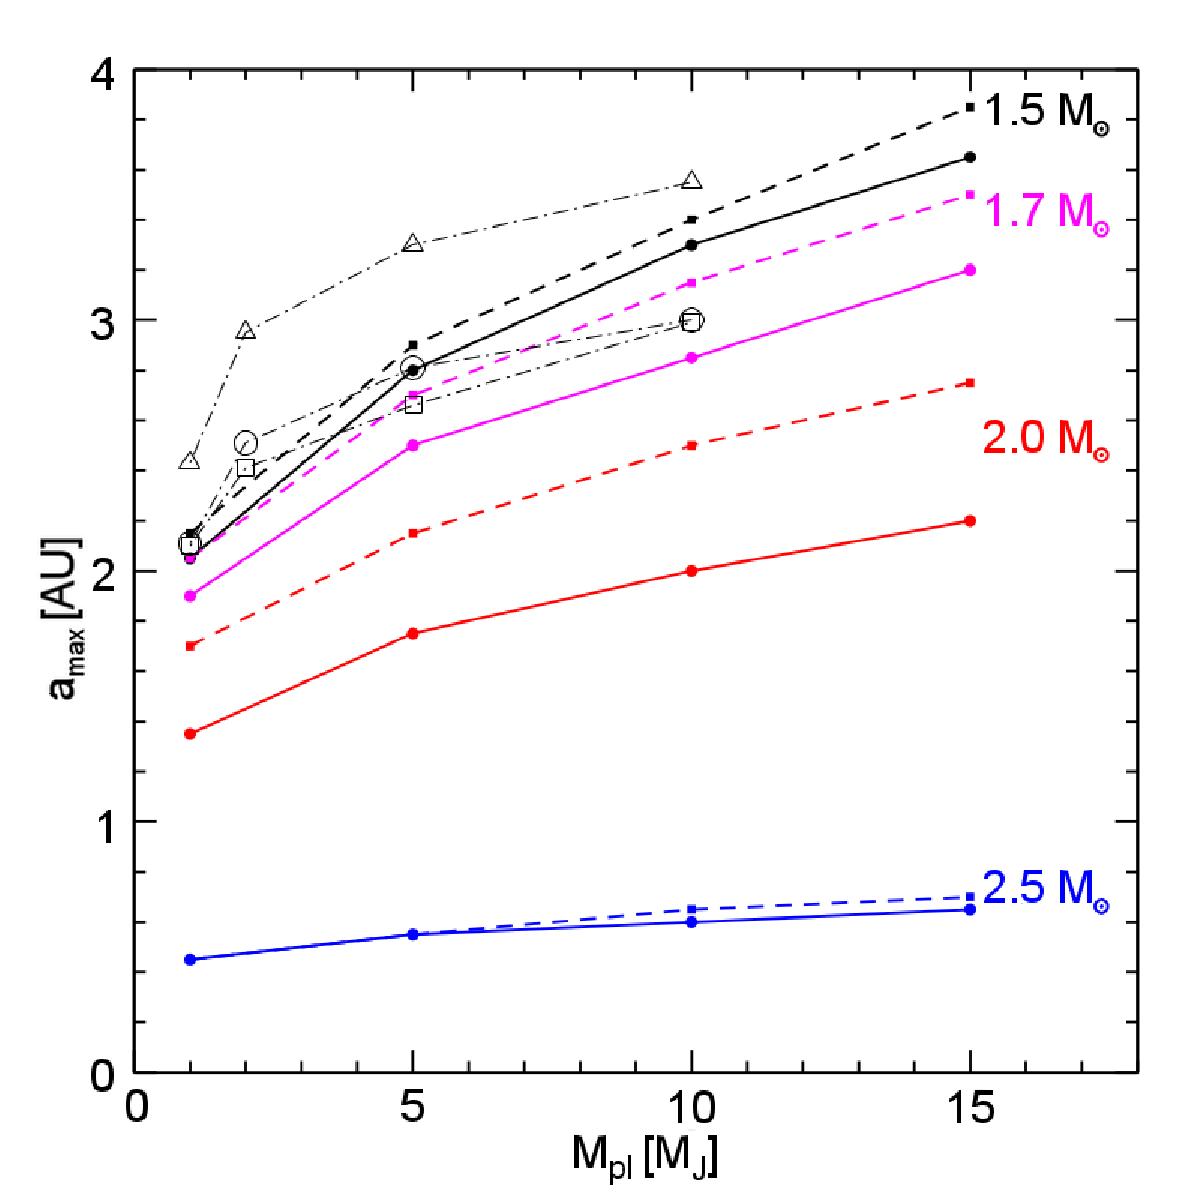
Variation of the maximum semi-major axis below which engulfment occurs during the RG ascent as a function of the mass of the planet, of the mass of the star, and its initial rotation rate. The dashed and continuous lines are, respectively, for an initial stellar angular velocity equal to 10% and 50% of the critical one. The empty symbols connected by light dashed-dotted lines are the results obtained by Villaver et al. (2014) for planets with masses of 1, 2, 5, and 10 MJ orbiting a non-rotating 1.5 M⊙ star. The triangles are for models using weak mass loss rates during the red giant phase (η = 0.2 in Eq. (1)), the circles are for models with normal RG mass losses (η = 0.5), and the squares are for models with η = 0.5 and overshooting.
Current usage metrics show cumulative count of Article Views (full-text article views including HTML views, PDF and ePub downloads, according to the available data) and Abstracts Views on Vision4Press platform.
Data correspond to usage on the plateform after 2015. The current usage metrics is available 48-96 hours after online publication and is updated daily on week days.
Initial download of the metrics may take a while.