Fig. 8
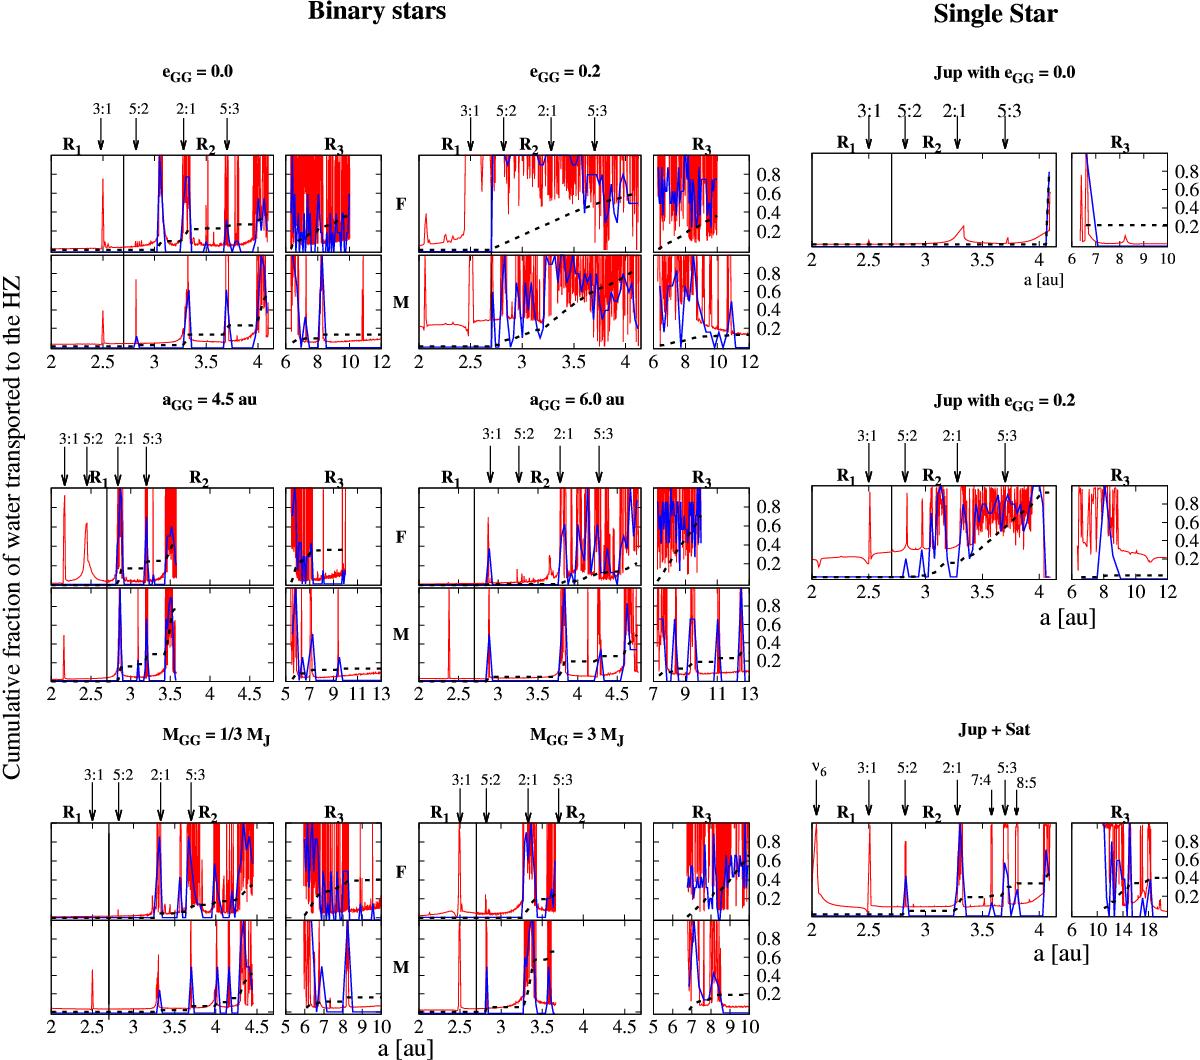
Left: influence of the gas giant’s orbital and physical parameters. Top and bottom subpanels are for a secondary F-type and M-type star, respectively. Right: the three subpanels show results for the case of single star systems. Each plot corresponds to an intermediate integration time of 10 Myr. See text in Sect. 5 and legend of Fig. 6 for more details.
Current usage metrics show cumulative count of Article Views (full-text article views including HTML views, PDF and ePub downloads, according to the available data) and Abstracts Views on Vision4Press platform.
Data correspond to usage on the plateform after 2015. The current usage metrics is available 48-96 hours after online publication and is updated daily on week days.
Initial download of the metrics may take a while.