Fig. 10
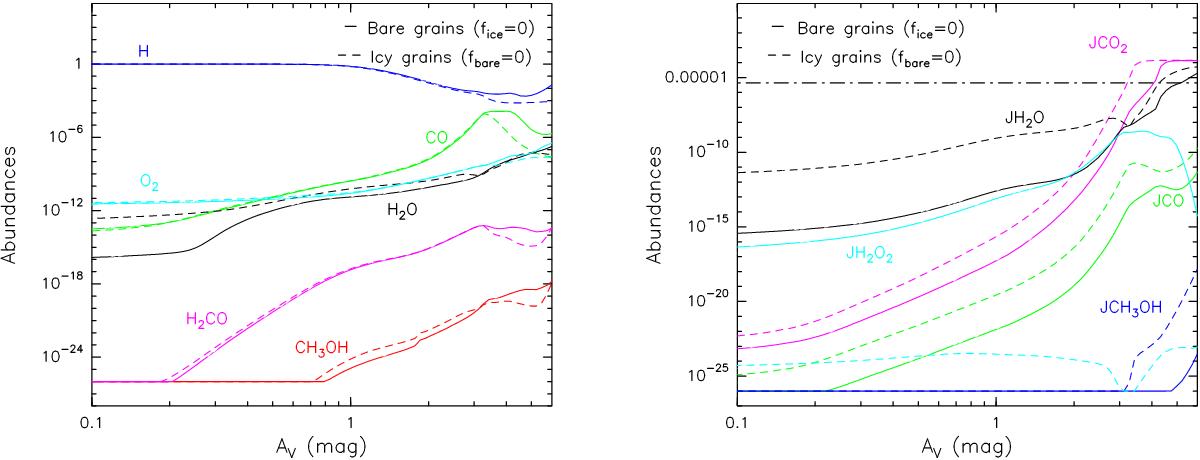
Comparison of the fractional abundances, n(x)/nH, for Model 1 (G0 = 104 and nH = 104 cm-3), considering bare grains fice = 0 (solid line) and icy grains fbare = 0 (dashed line). Left panel: H, CO, O2, H2O, H2CO, and CH3OH. Right panel: solid CO, CO2, H2O, H2O2, and CH3OH. The dash-dotted black line represents the number of possible attachable sites on grain surfaces per cm3 (the limit to form one full monolayer of ice).
Current usage metrics show cumulative count of Article Views (full-text article views including HTML views, PDF and ePub downloads, according to the available data) and Abstracts Views on Vision4Press platform.
Data correspond to usage on the plateform after 2015. The current usage metrics is available 48-96 hours after online publication and is updated daily on week days.
Initial download of the metrics may take a while.