Fig. 9
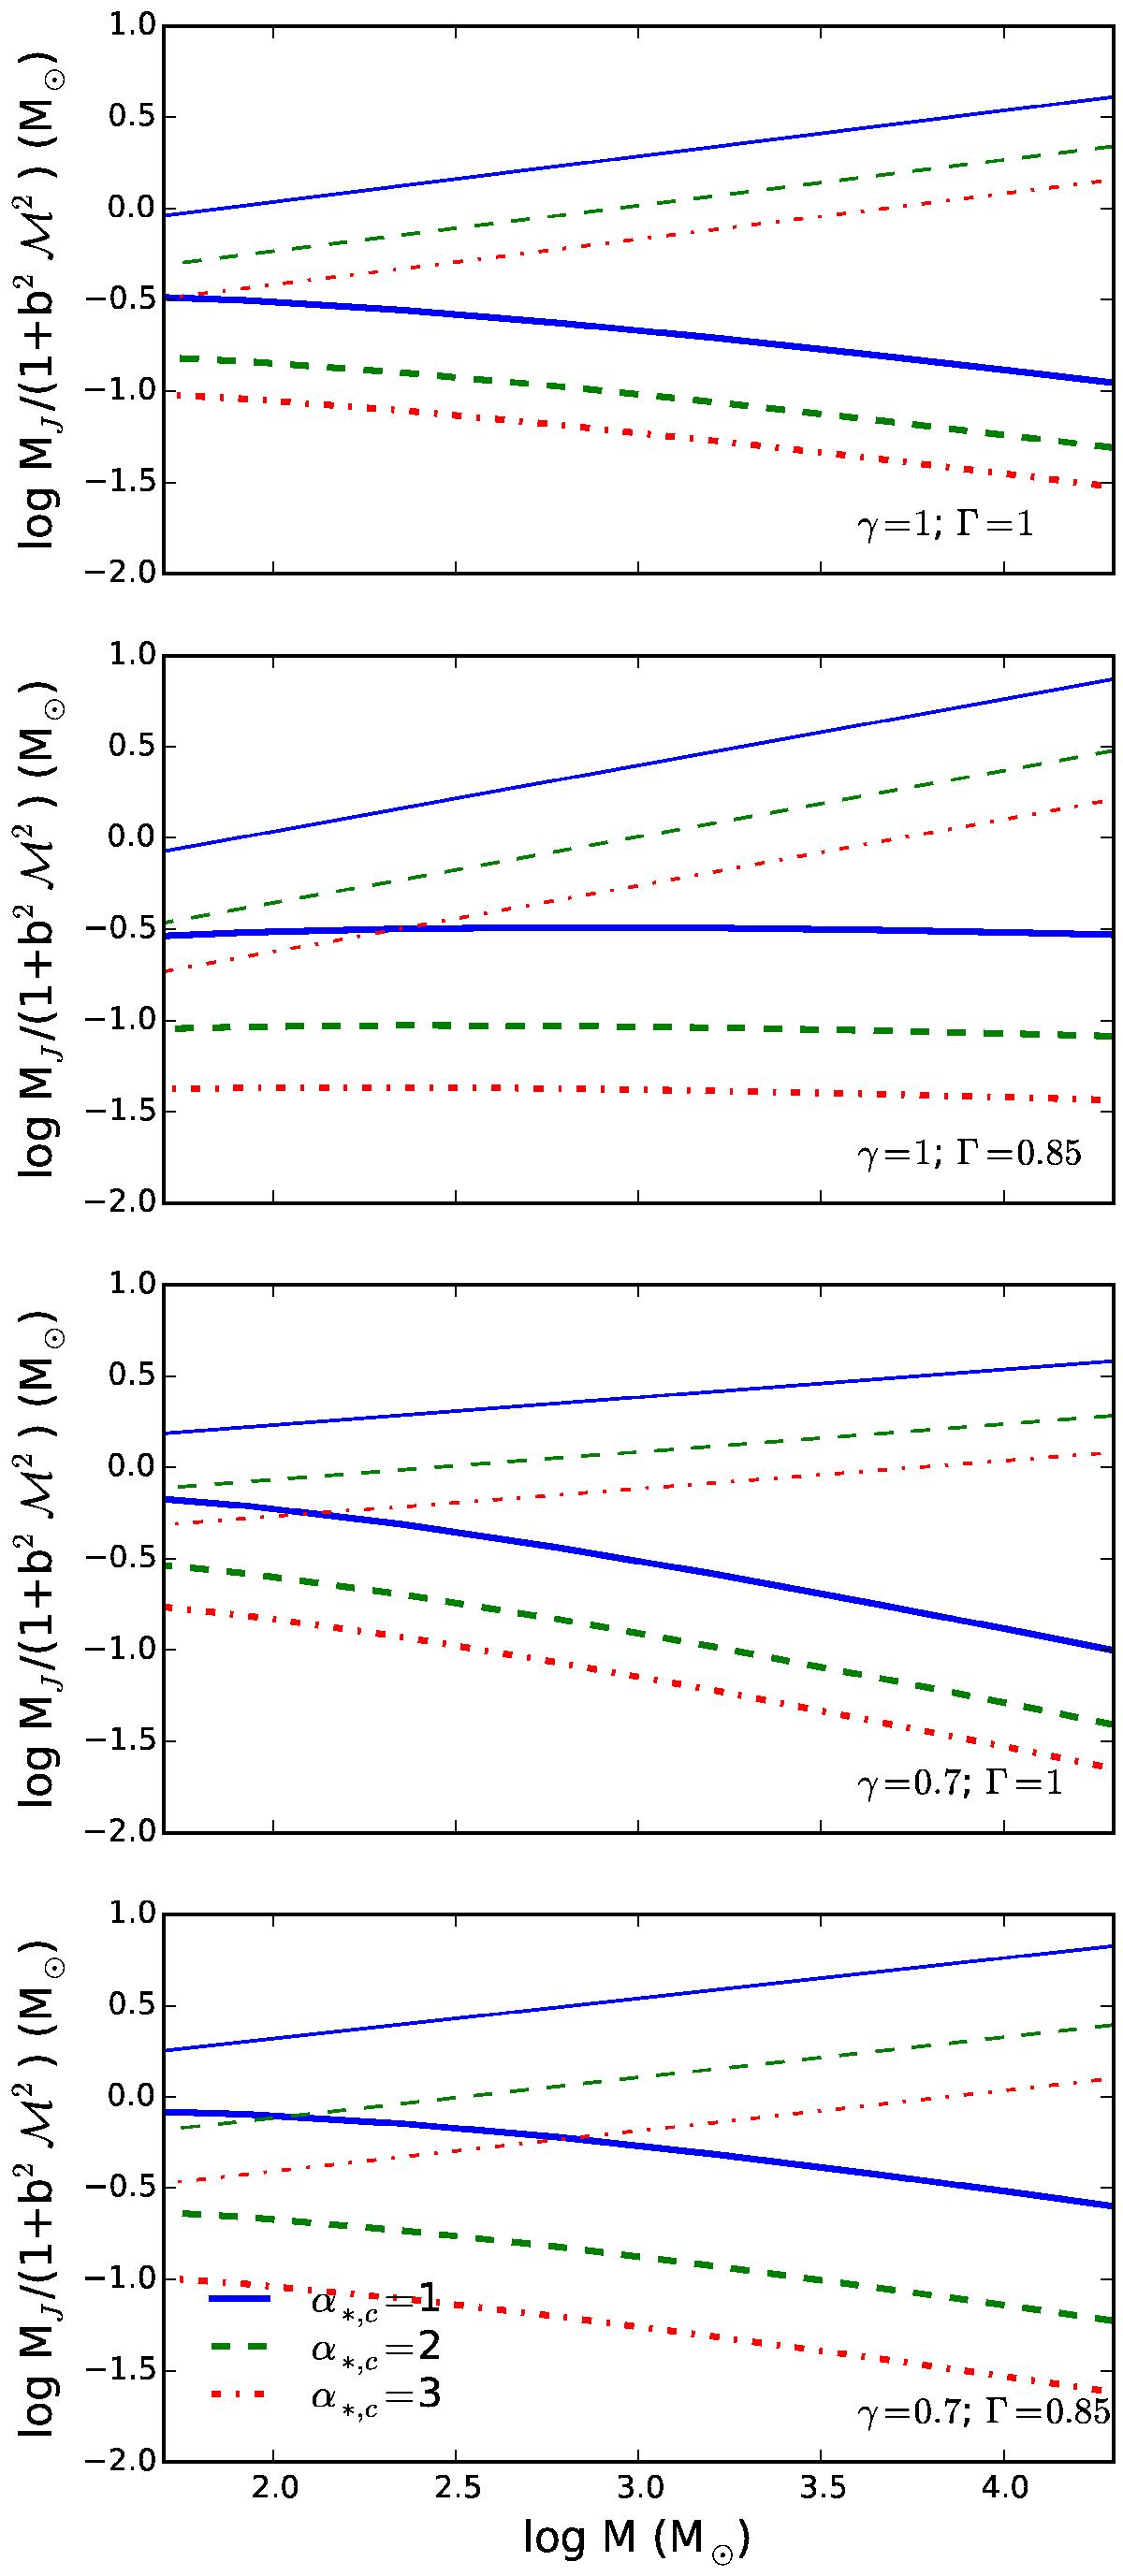
Initial mass function peak prediction from protocluster model with isotropic turbulence for cloud-cluster mass ratio α∗ ,c = 1,2,3 plotted against protocluster mass. The values 1 and 0.7 are used for the Larson relation ρ ∝ R− γ. As for the polytropic index Γ of gas inside the protocluster, values 1 (isothermal) and 0.85 are considered. The Jeans mass is plotted with thin curves, and the IMF peak mass is plotted with thick curves. Color codings are same as those in Fig. 6.
Current usage metrics show cumulative count of Article Views (full-text article views including HTML views, PDF and ePub downloads, according to the available data) and Abstracts Views on Vision4Press platform.
Data correspond to usage on the plateform after 2015. The current usage metrics is available 48-96 hours after online publication and is updated daily on week days.
Initial download of the metrics may take a while.