Fig. 8
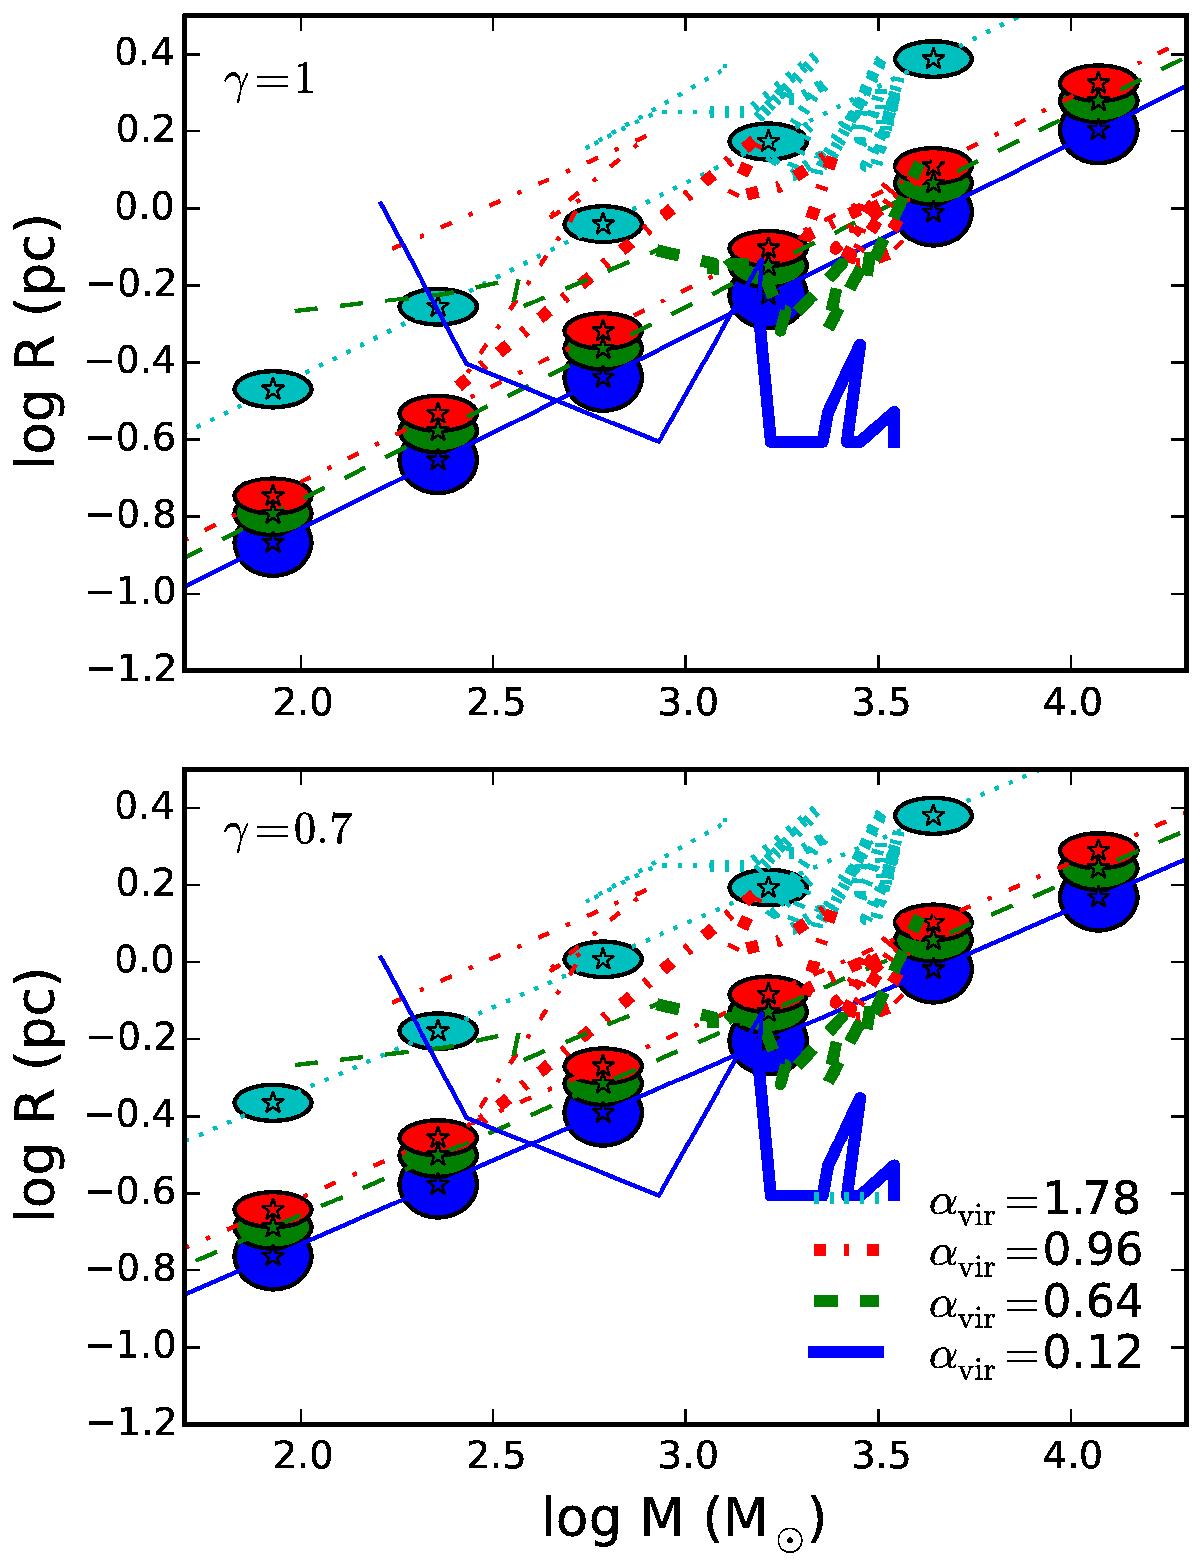
Mass-size relation of ellipsoidal clusters; the total mass inside the ellipsoidal region defined with gas kinematics overplotted with a model of the corresponding levels of turbulence with γ = 1 (upper panel) and 0.7 (lower panel). The velocity dispersion increases from the bottom to the top curve. Simulation results at time before 2 Myr are plotted with thin lines. The model is in good agreement with simulation only after the protocluster gains enough mass, possibly implying that the time dependent terms and ram pressure should not be neglected at early stage.
Current usage metrics show cumulative count of Article Views (full-text article views including HTML views, PDF and ePub downloads, according to the available data) and Abstracts Views on Vision4Press platform.
Data correspond to usage on the plateform after 2015. The current usage metrics is available 48-96 hours after online publication and is updated daily on week days.
Initial download of the metrics may take a while.