Fig. 6
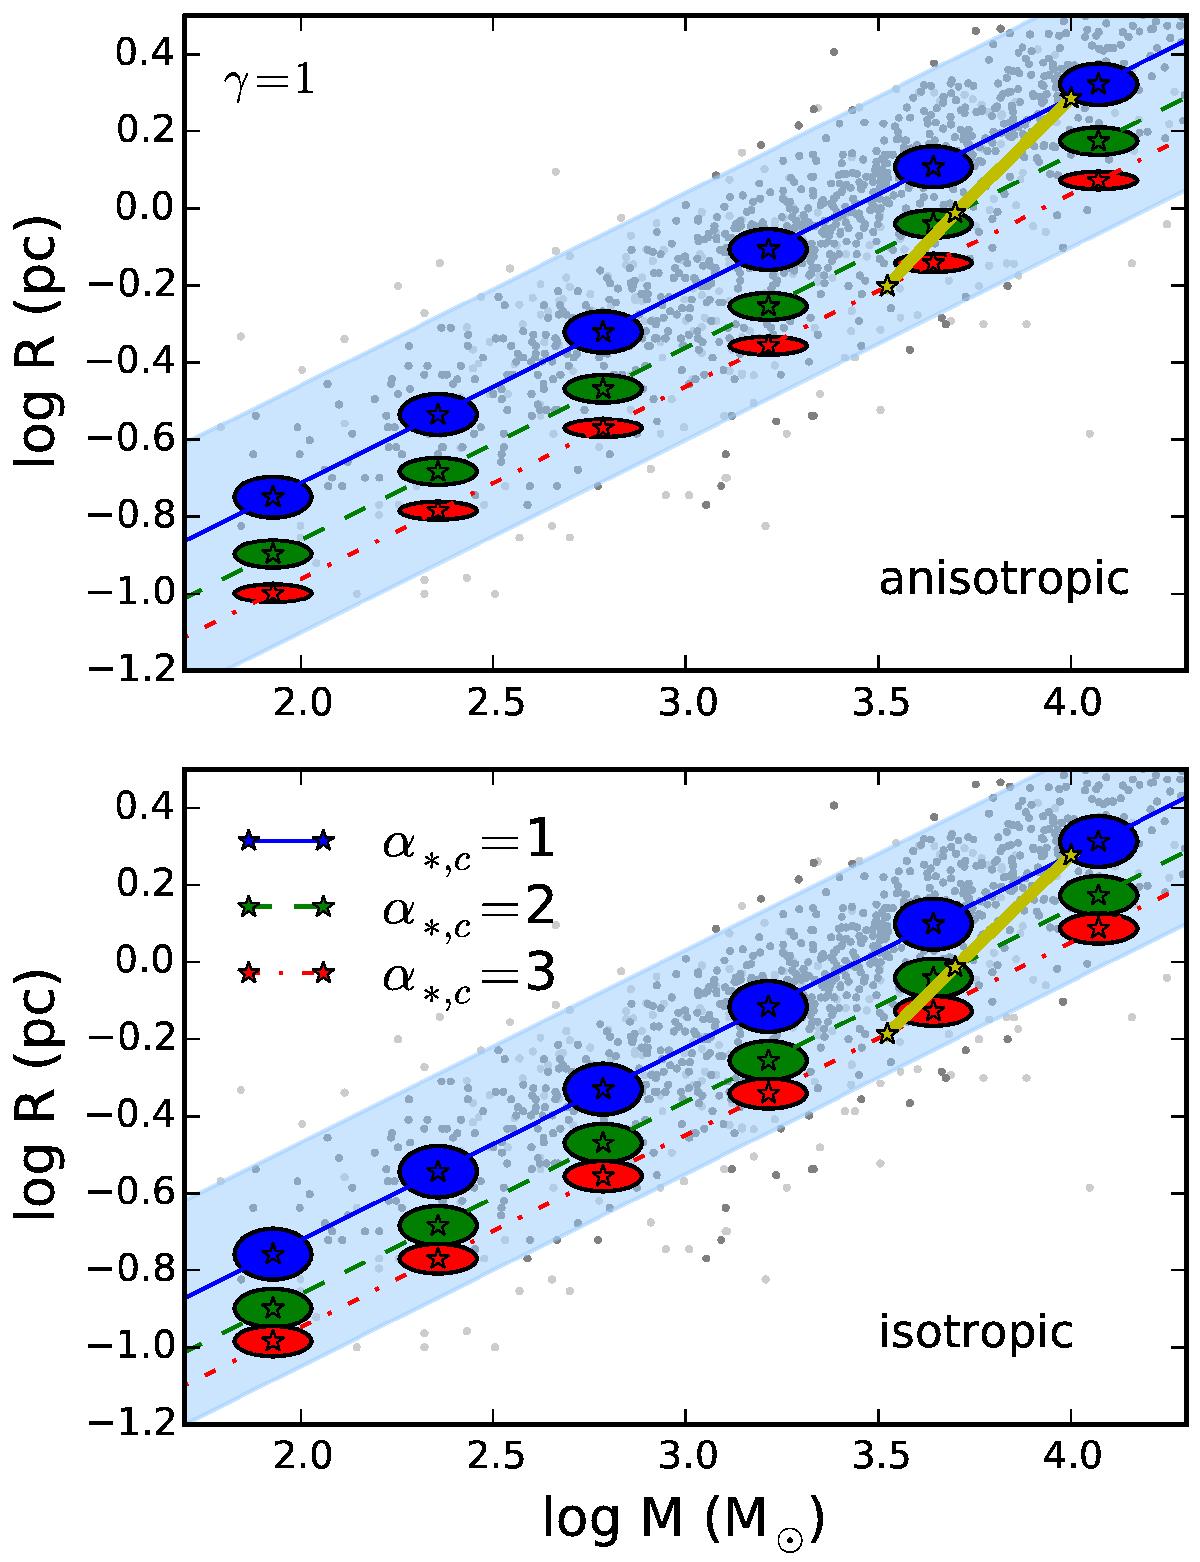
Mass-size relation of ellipsoidal clusters, shown with cloud-cluster mass ratio α∗ ,c = 1,2,3, which are plotted with blue solid, green dashed, red dot-dashed lines, respectively, using anisotropic turbulence following Kolmogorov spectrum (upper panel) and isotropic turbulence (lower panel). The turbulence efficiency ε = 0.5 is used, and the shadowed region represents the range of solutions for ε ∈ [0.2,0.7]. The elliptical patches represent the form of the clusters. With the molecular cloud density-size relation ρ ∝ R-1, the clusters follow a R ∝ M0.5 trend for a given α∗ ,c. The gaseous protocluster corresponding to 104 M⊙ cloud is traced in yellow, which is indicative of an evolutionary sequence roughly following R ∝ M. The radius of the gaseous protocluster does not depend too much on the underlying assumption of the turbulent energy distribution, while the aspect ratio is smaller in the anisotropic case. The dots are the observed star-forming clumps from Fall et al. (2010) and Urquhart et al. (2014).
Current usage metrics show cumulative count of Article Views (full-text article views including HTML views, PDF and ePub downloads, according to the available data) and Abstracts Views on Vision4Press platform.
Data correspond to usage on the plateform after 2015. The current usage metrics is available 48-96 hours after online publication and is updated daily on week days.
Initial download of the metrics may take a while.