Free Access
Fig. 5
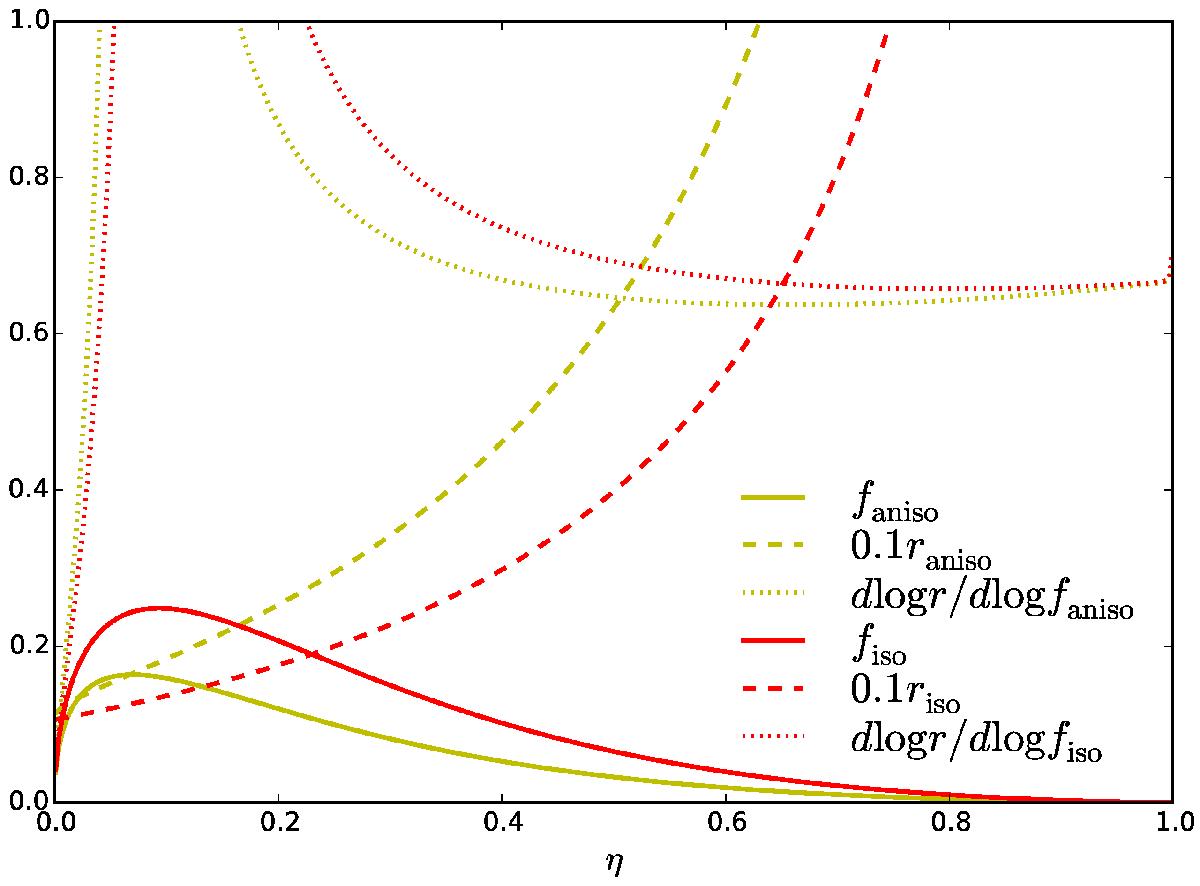
Functions f(η) (solid curves) and r(η) (dashed curves, the value multiplied by 0.1 to be shown in the same figure) for both anisotropic (yellow) and isotropic (red) assumptions of the turbulence. Dotted curves indicate the ratio between the changing rates of r and f plotted in absolute value.
Current usage metrics show cumulative count of Article Views (full-text article views including HTML views, PDF and ePub downloads, according to the available data) and Abstracts Views on Vision4Press platform.
Data correspond to usage on the plateform after 2015. The current usage metrics is available 48-96 hours after online publication and is updated daily on week days.
Initial download of the metrics may take a while.