Fig. 3
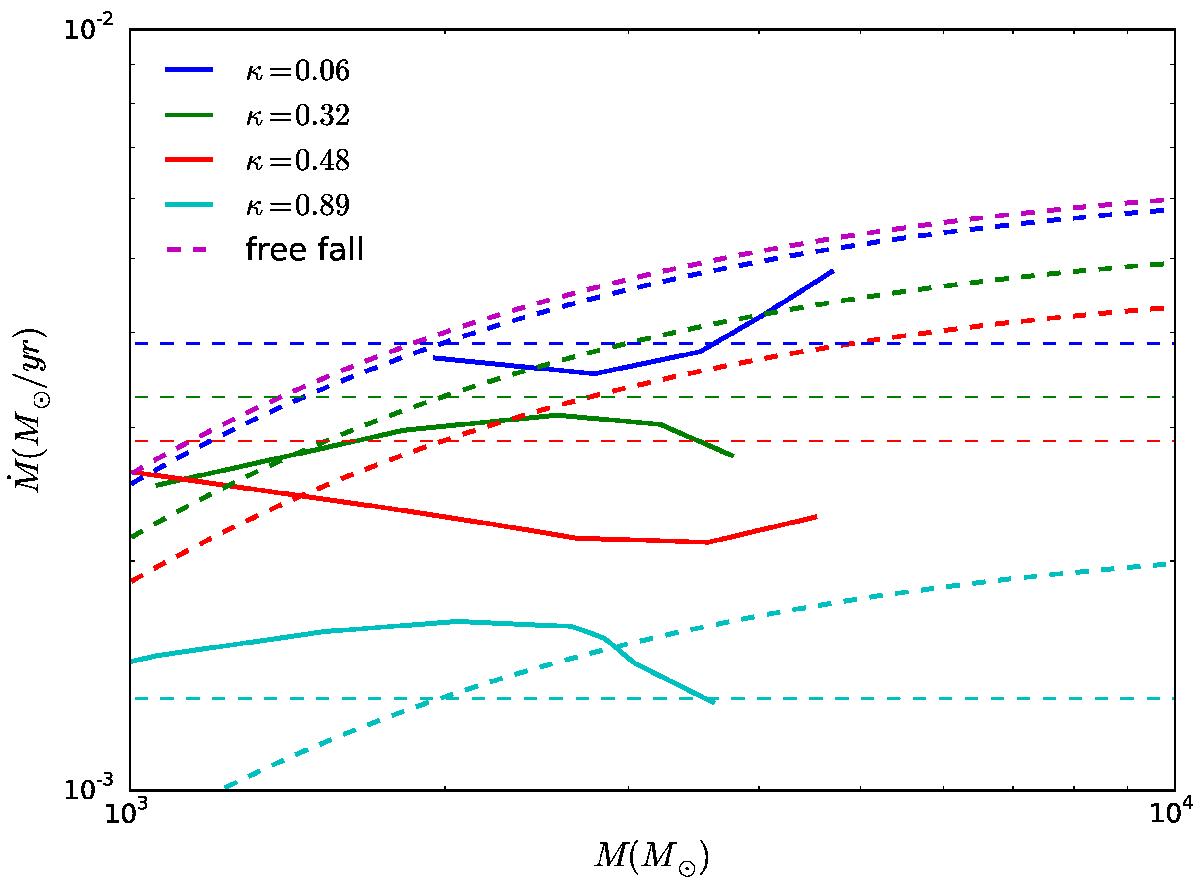
Mass accretion rate plotted against mass at r = 1 pc. The solid curves represent values evaluated in simulations with different levels of turbulent support, where κ is the ratio of turbulent over gravitational energy. The dashed curve in magenta is the analytical solution for a 104 M⊙ cloud in free fall. The accretion rate with the empirical correction ![]() is plotted in dashed curves with corresponding colors. The accretion rate is approximated to be constant at its value at M∗ = 2 × 10³ M⊙.
is plotted in dashed curves with corresponding colors. The accretion rate is approximated to be constant at its value at M∗ = 2 × 10³ M⊙.
Current usage metrics show cumulative count of Article Views (full-text article views including HTML views, PDF and ePub downloads, according to the available data) and Abstracts Views on Vision4Press platform.
Data correspond to usage on the plateform after 2015. The current usage metrics is available 48-96 hours after online publication and is updated daily on week days.
Initial download of the metrics may take a while.