Fig. 3
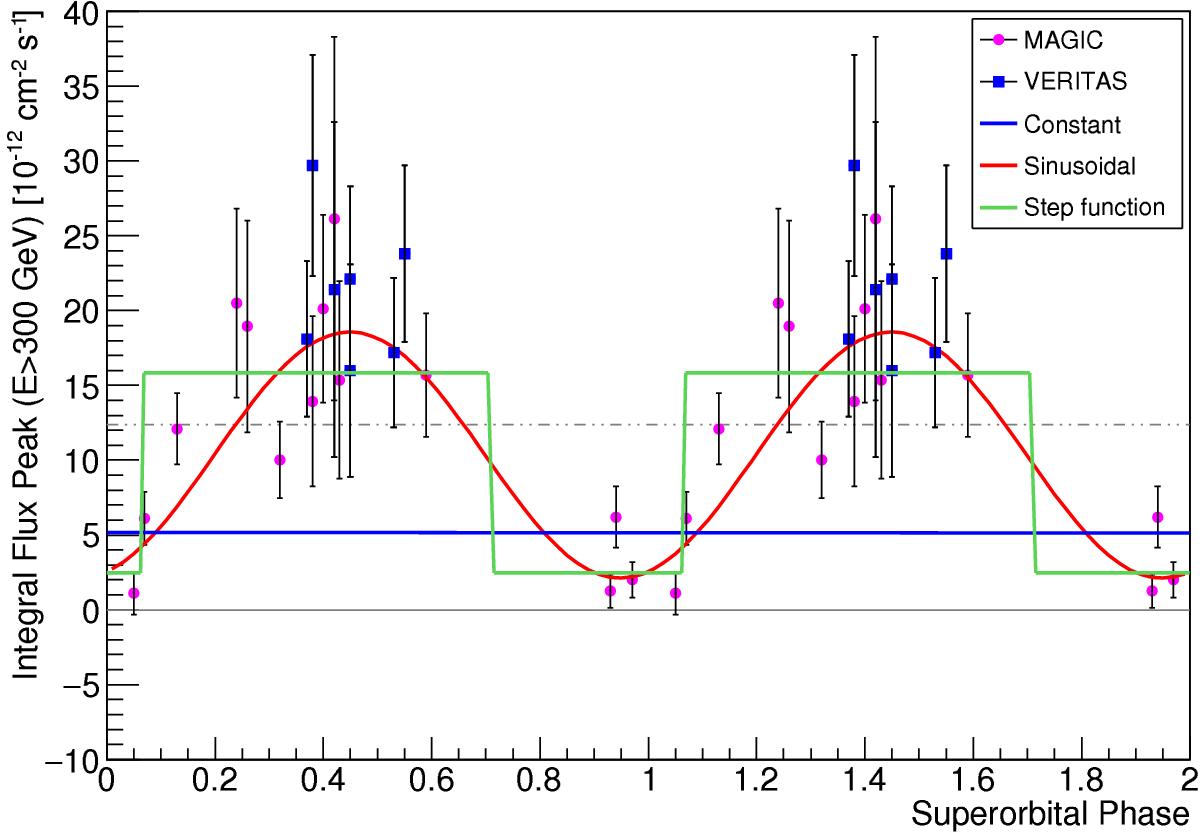
Peak of the VHE emission in terms of the super-orbital phase defined in radio. Each data point represents the peak flux emitted in one orbital period during orbital phases 0.5–0.75 and is folded into the super-orbit of 1667 days known from radio observations (Gregory 2002). MAGIC (magenta dots) and VERITAS (blue squares) points have been used in this analysis. The fit with a sinusoidal (solid red line), with a step function (solid green line), and with a constant (solid blue line) are also represented. The gray dashed line represents 10% of the Crab Nebula flux, the gray solid line the zero level for reference.
Current usage metrics show cumulative count of Article Views (full-text article views including HTML views, PDF and ePub downloads, according to the available data) and Abstracts Views on Vision4Press platform.
Data correspond to usage on the plateform after 2015. The current usage metrics is available 48-96 hours after online publication and is updated daily on week days.
Initial download of the metrics may take a while.