Fig. 2
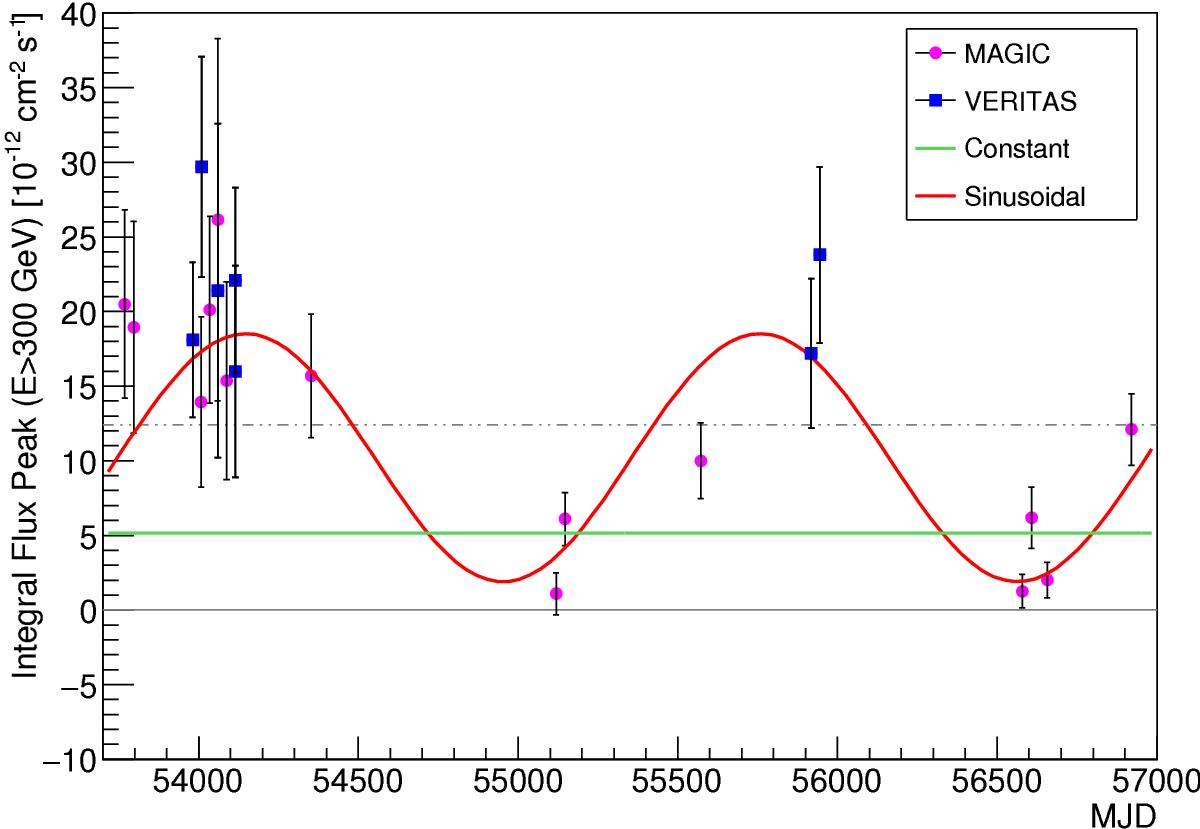
Temporal evolution of the peak of the VHE emission for each orbital period in terms of the MJD. MAGIC (magenta dots) and VERITAS (blue squares) data within orbital phases 0.5–0.75 have been considered. The gray dashed line represents 10% of the Crab Nebula flux, the gray solid line the zero level. The fit with a sinusoidal is plotted in red and the fit with a constant in blue.
Current usage metrics show cumulative count of Article Views (full-text article views including HTML views, PDF and ePub downloads, according to the available data) and Abstracts Views on Vision4Press platform.
Data correspond to usage on the plateform after 2015. The current usage metrics is available 48-96 hours after online publication and is updated daily on week days.
Initial download of the metrics may take a while.