Fig. 2
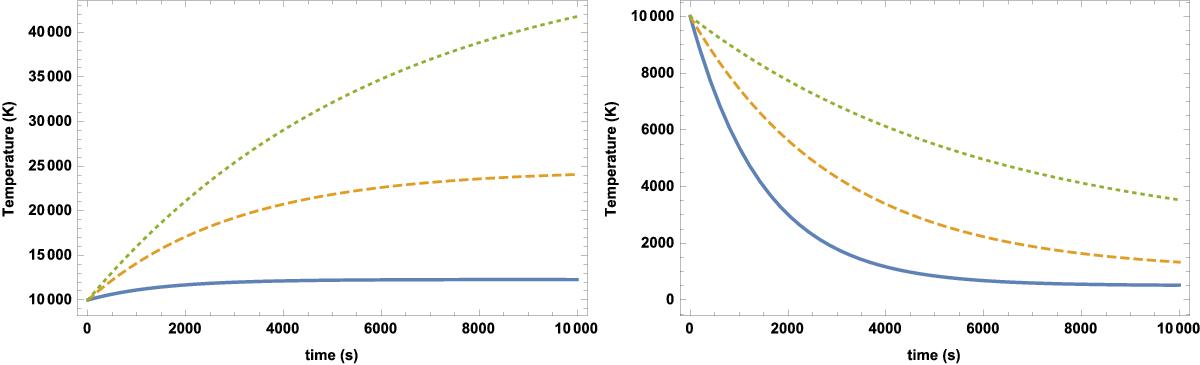
Left panel: temporal variation of the prominence plasma temperature for H = 8.5 × 10⁻⁶ W m-3 and different characteristic times, τ = 1500 s (continuous line), 3000 s (dashed line), 6000 s (dotted line). Right panel: temporal variation of the prominence plasma temperature for H = 3.5 × 10⁻⁷ W m-3 and different characteristic times, τ = 1500 s (continuous line), 3000 s (dashed line), 6000 s (dotted line). In these plots T0i = 10 000 K.
Current usage metrics show cumulative count of Article Views (full-text article views including HTML views, PDF and ePub downloads, according to the available data) and Abstracts Views on Vision4Press platform.
Data correspond to usage on the plateform after 2015. The current usage metrics is available 48-96 hours after online publication and is updated daily on week days.
Initial download of the metrics may take a while.