Fig. 1
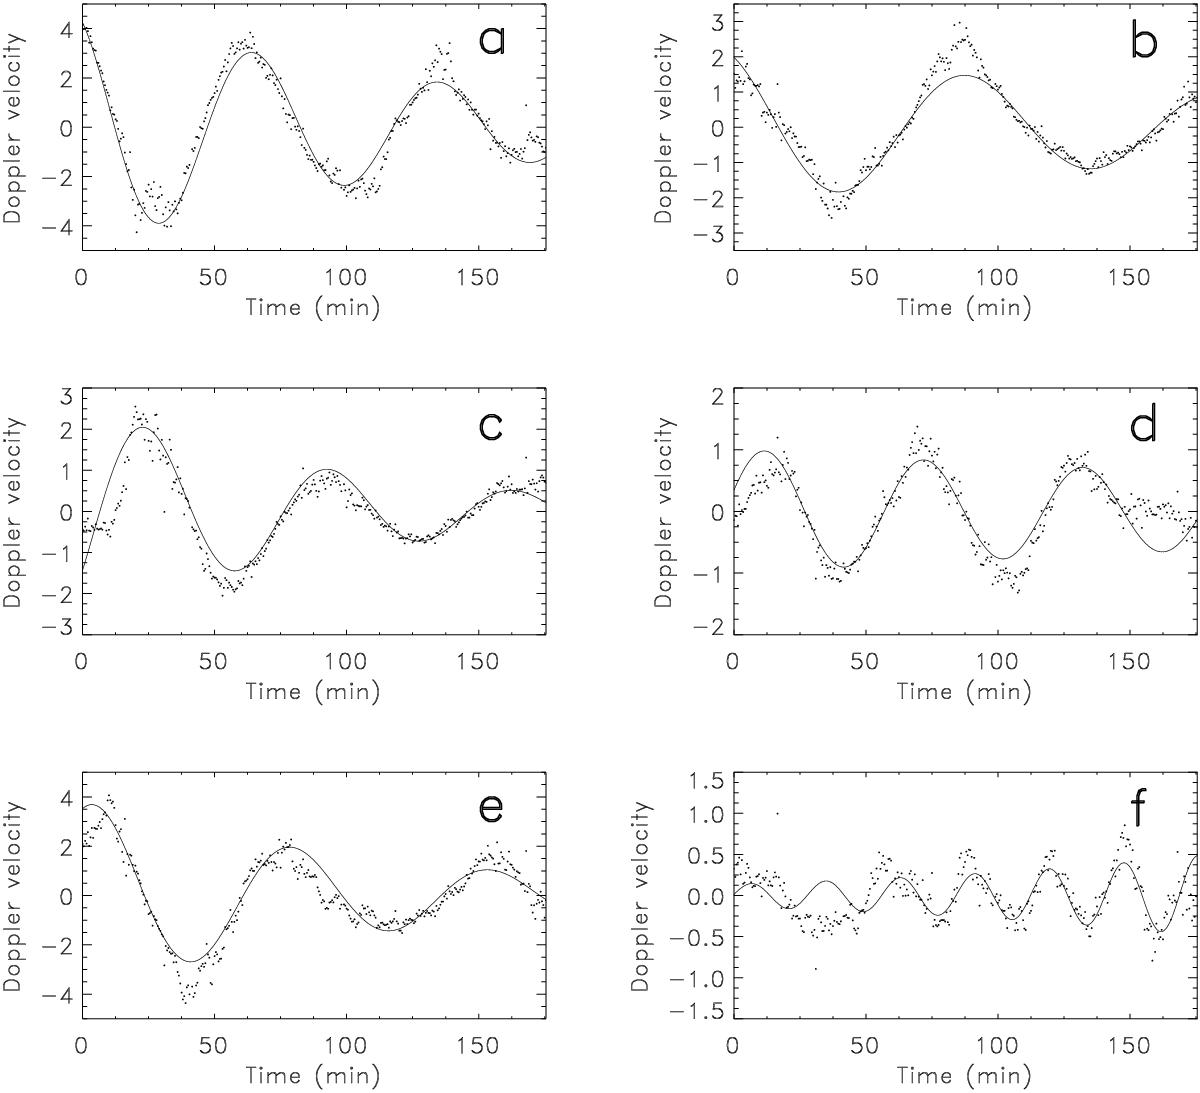
Doppler velocities (km s-1) as a function of time for six different spatial locations in a prominence. Dots denote observational data, while solid lines correspond to an analytical fit such as: ![]() , with v0, the initial velocity amplitude, P, the period, τD, the damping time, and φ, the phase. Adapted from Molowny-Horas et al. (1999).
, with v0, the initial velocity amplitude, P, the period, τD, the damping time, and φ, the phase. Adapted from Molowny-Horas et al. (1999).
Current usage metrics show cumulative count of Article Views (full-text article views including HTML views, PDF and ePub downloads, according to the available data) and Abstracts Views on Vision4Press platform.
Data correspond to usage on the plateform after 2015. The current usage metrics is available 48-96 hours after online publication and is updated daily on week days.
Initial download of the metrics may take a while.