Free Access
Fig. 9
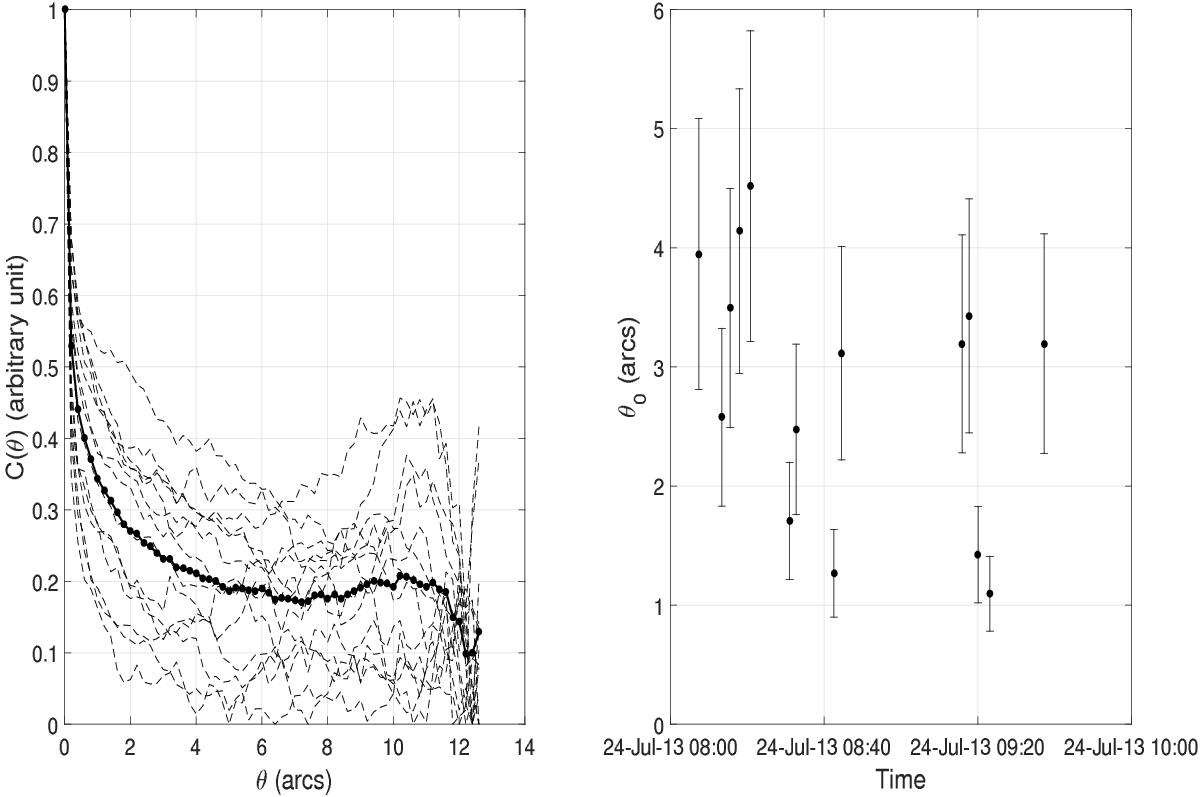
Left: angular covariance samples of AA-fluctuations (dashed lines) and the mean computed over the 24 June 2013 observations (bold line) recorded in image plane mode. Right: some isoplanatic angles of the AA-fluctuations deduced from the covariance curves.
Current usage metrics show cumulative count of Article Views (full-text article views including HTML views, PDF and ePub downloads, according to the available data) and Abstracts Views on Vision4Press platform.
Data correspond to usage on the plateform after 2015. The current usage metrics is available 48-96 hours after online publication and is updated daily on week days.
Initial download of the metrics may take a while.