Fig. 7
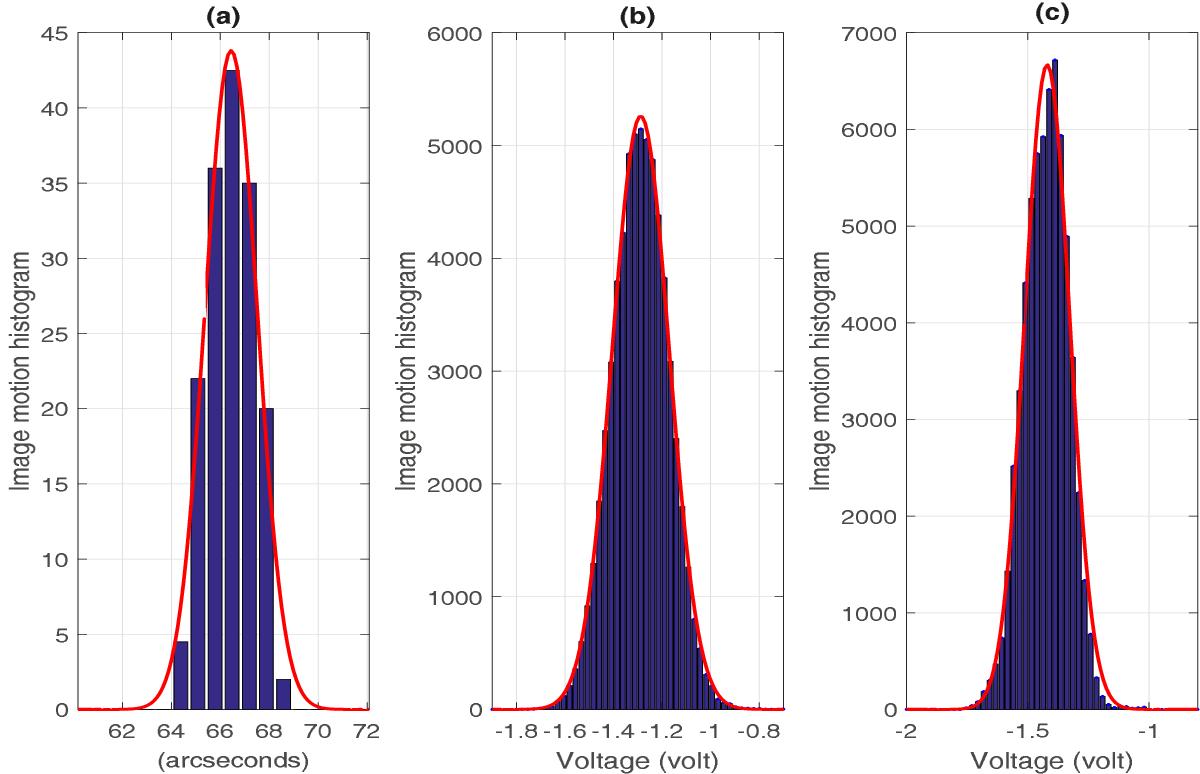
Histogram of AA-fluctuations obtained from an image series recorded 24 July 2013 in image plane mode (a). The same histogram obtained at the same time with the 1 mm (b) and with the full intensity (whole pupil) photodiodes (c) of the pupil plane mode. The red curve is the AA-fluctuations Gaussian fit where R2 is always greater than 0.97.
Current usage metrics show cumulative count of Article Views (full-text article views including HTML views, PDF and ePub downloads, according to the available data) and Abstracts Views on Vision4Press platform.
Data correspond to usage on the plateform after 2015. The current usage metrics is available 48-96 hours after online publication and is updated daily on week days.
Initial download of the metrics may take a while.