Fig. 13
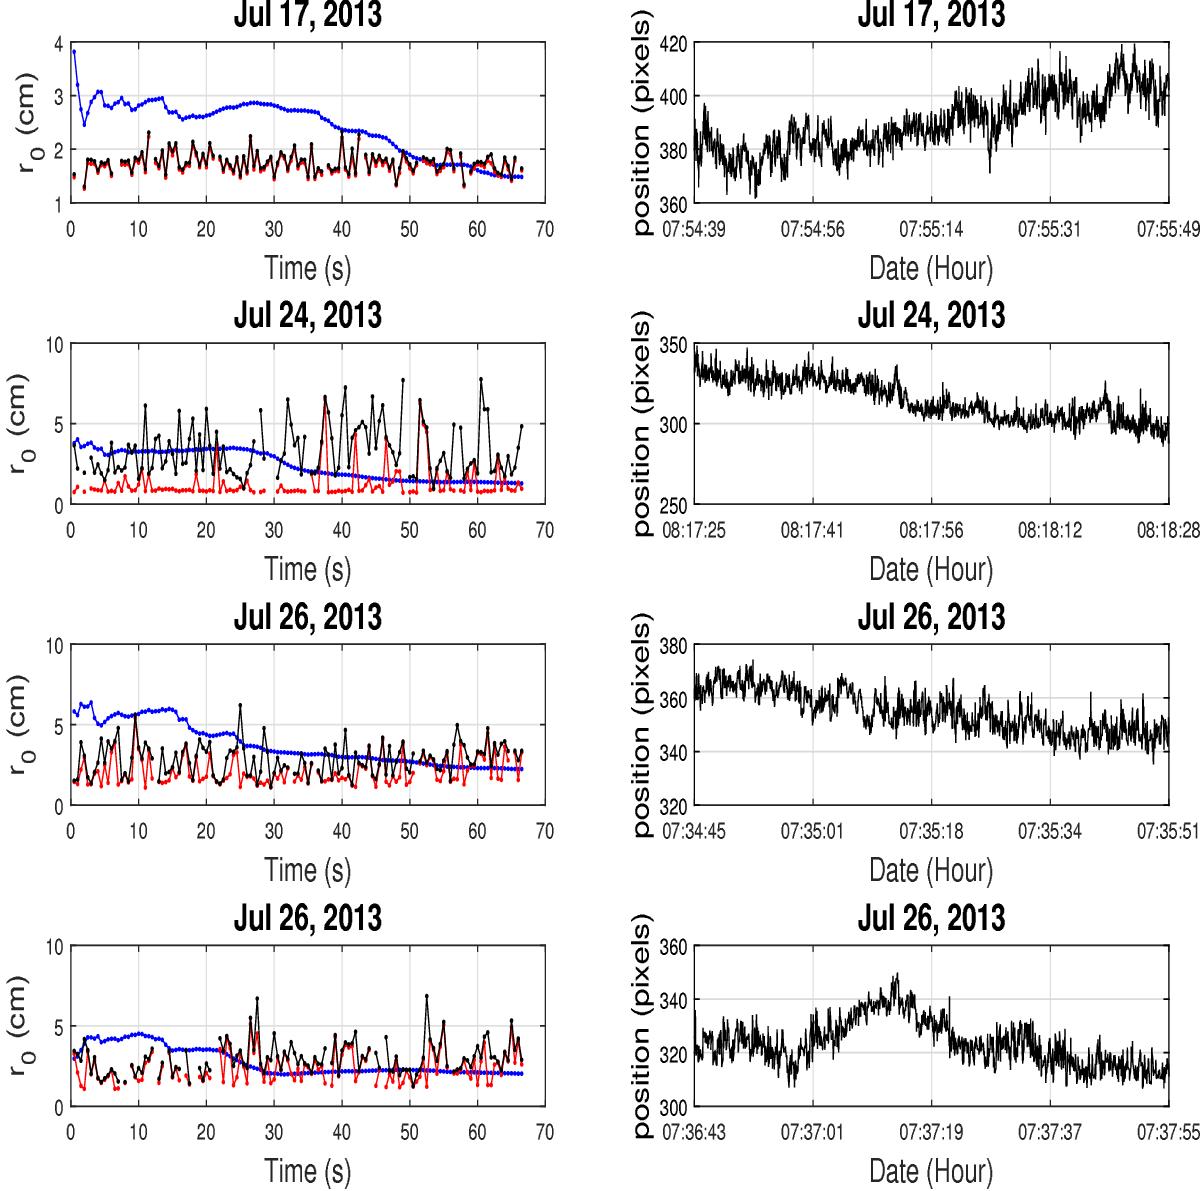
Left curves: Fried’s parameter r0 obtained with the Kolmogorov (black) and Von Kàrmàn (red) models using images recorded on 17, 24, and 26 July 2013. Fried’s parameter r0 obtained with Eq. (4) for the Kolmogorov model is plotted in blue. Right curves: the temporal mean positions of the solar limb leading to r0 estimates from AA-fluctuations using the Kolmogorov model.
Current usage metrics show cumulative count of Article Views (full-text article views including HTML views, PDF and ePub downloads, according to the available data) and Abstracts Views on Vision4Press platform.
Data correspond to usage on the plateform after 2015. The current usage metrics is available 48-96 hours after online publication and is updated daily on week days.
Initial download of the metrics may take a while.