Fig. 10
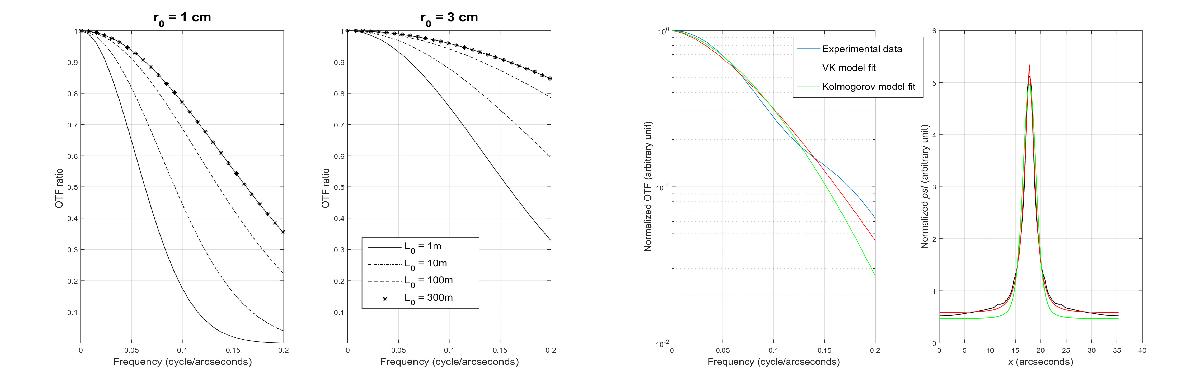
ℒ0 effect on the OTF for typical r0 values (left plots). The ratio between the Von Kàrmàn and Kolmogorov OTF models is used as an illustration. The effect is more significant in the low frequency range (below 0.2 cycles per arcsecond) for small r0 and ℒ0 values. The right plots display an experimental OTF fitted with the two models (left) and the corresponding PSFs (right). Frequencies below 0.2 cycles per arcsecond are considered for the fits since there is more noise at higher frequencies.
Current usage metrics show cumulative count of Article Views (full-text article views including HTML views, PDF and ePub downloads, according to the available data) and Abstracts Views on Vision4Press platform.
Data correspond to usage on the plateform after 2015. The current usage metrics is available 48-96 hours after online publication and is updated daily on week days.
Initial download of the metrics may take a while.