Fig. 1
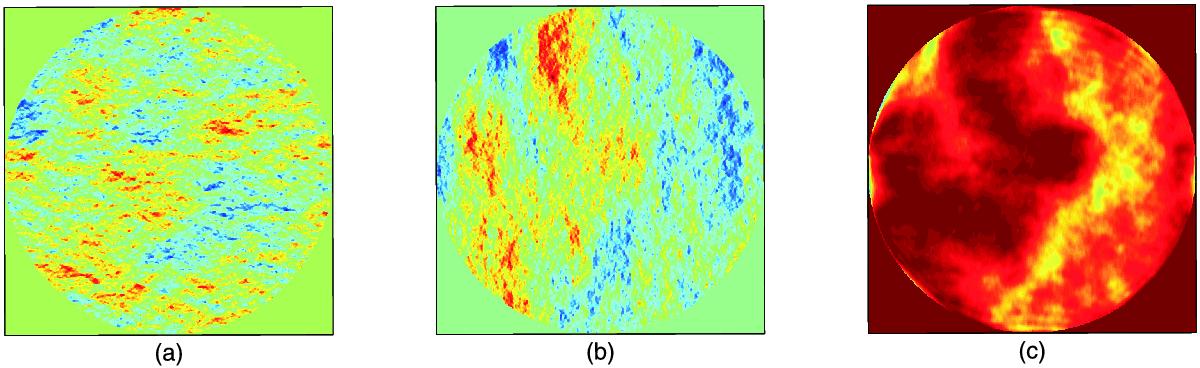
Simulated AA-fluctuations computed directly from the perturbed wavefront phase and observed as intensity fluctuations in the pupil plane image. a) and b) are respectively x and yAA components at the entrance pupil, while c) is the y component observed in the pupil plane image as intensity fluctuations. The perturbed wavefront was simulated in the near-field approximation case considering r0 = 4 cm, ℒ0 = 10 m, and h = 1000 m. The diaphragm width was taken as equal to a few arcseconds.
Current usage metrics show cumulative count of Article Views (full-text article views including HTML views, PDF and ePub downloads, according to the available data) and Abstracts Views on Vision4Press platform.
Data correspond to usage on the plateform after 2015. The current usage metrics is available 48-96 hours after online publication and is updated daily on week days.
Initial download of the metrics may take a while.