Fig. 8
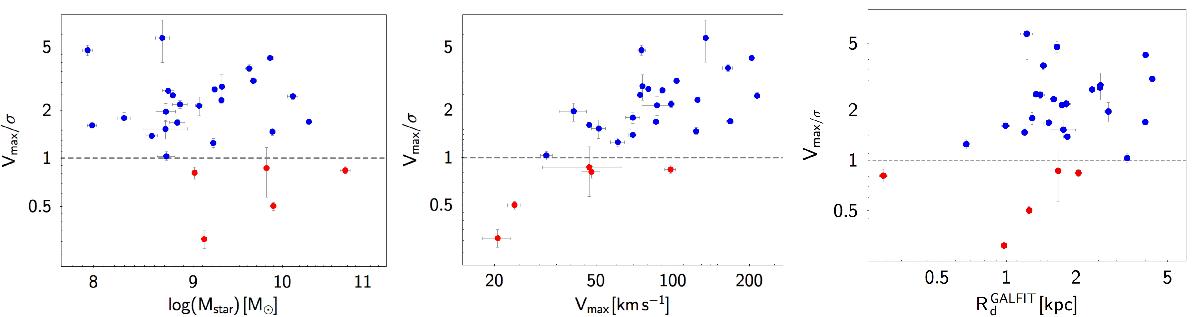
Ratio V/σ as a function of galaxy stellar mass (left panel), maximum rotational velocity (middle panel), and size (right panel). The horizontal dashed lines set the limit between rotation-dominated (blue points above the line) and dispersion-dominated (red points below the line) galaxies. No clear correlation is seen but dispersion-dominated galaxies are mostly massive (>109M⊙), slowly rotating (≤50 km s-1), and compact.
Current usage metrics show cumulative count of Article Views (full-text article views including HTML views, PDF and ePub downloads, according to the available data) and Abstracts Views on Vision4Press platform.
Data correspond to usage on the plateform after 2015. The current usage metrics is available 48-96 hours after online publication and is updated daily on week days.
Initial download of the metrics may take a while.