Fig. 7
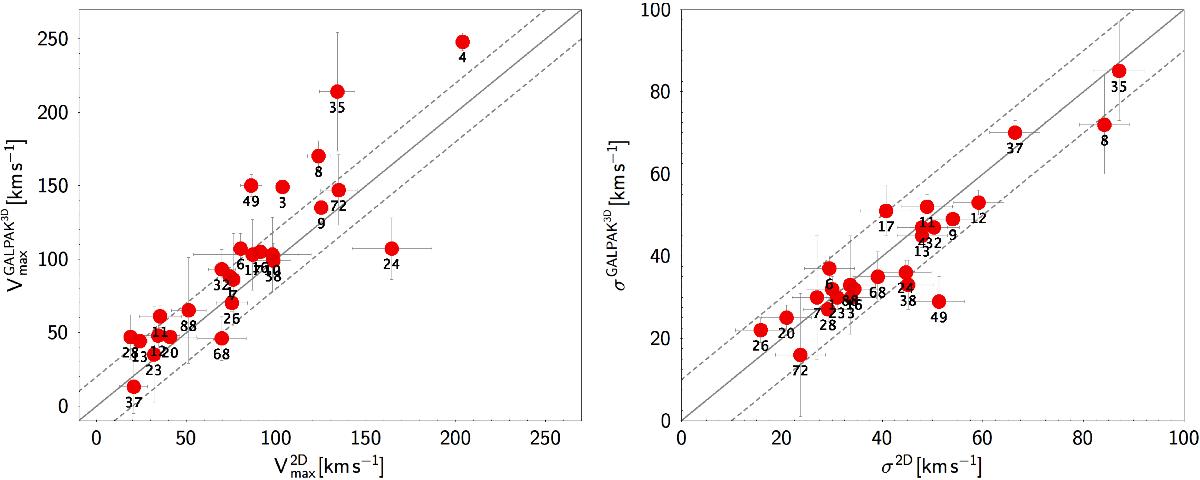
Comparison of the values obtained with 2D modeling to those obtained with GalPaK3D for disk maximum rotational velocity (left panel) and velocity dispersion (right panel) for the spatially resolved MUSE-HDFS galaxies (red points). Labels indicate the galaxy IDs. The solid line represents the 1:1 relation and the dashed lines indicate the typical scatter around this relation due to measurement uncertainties.
Current usage metrics show cumulative count of Article Views (full-text article views including HTML views, PDF and ePub downloads, according to the available data) and Abstracts Views on Vision4Press platform.
Data correspond to usage on the plateform after 2015. The current usage metrics is available 48-96 hours after online publication and is updated daily on week days.
Initial download of the metrics may take a while.