Fig. 10
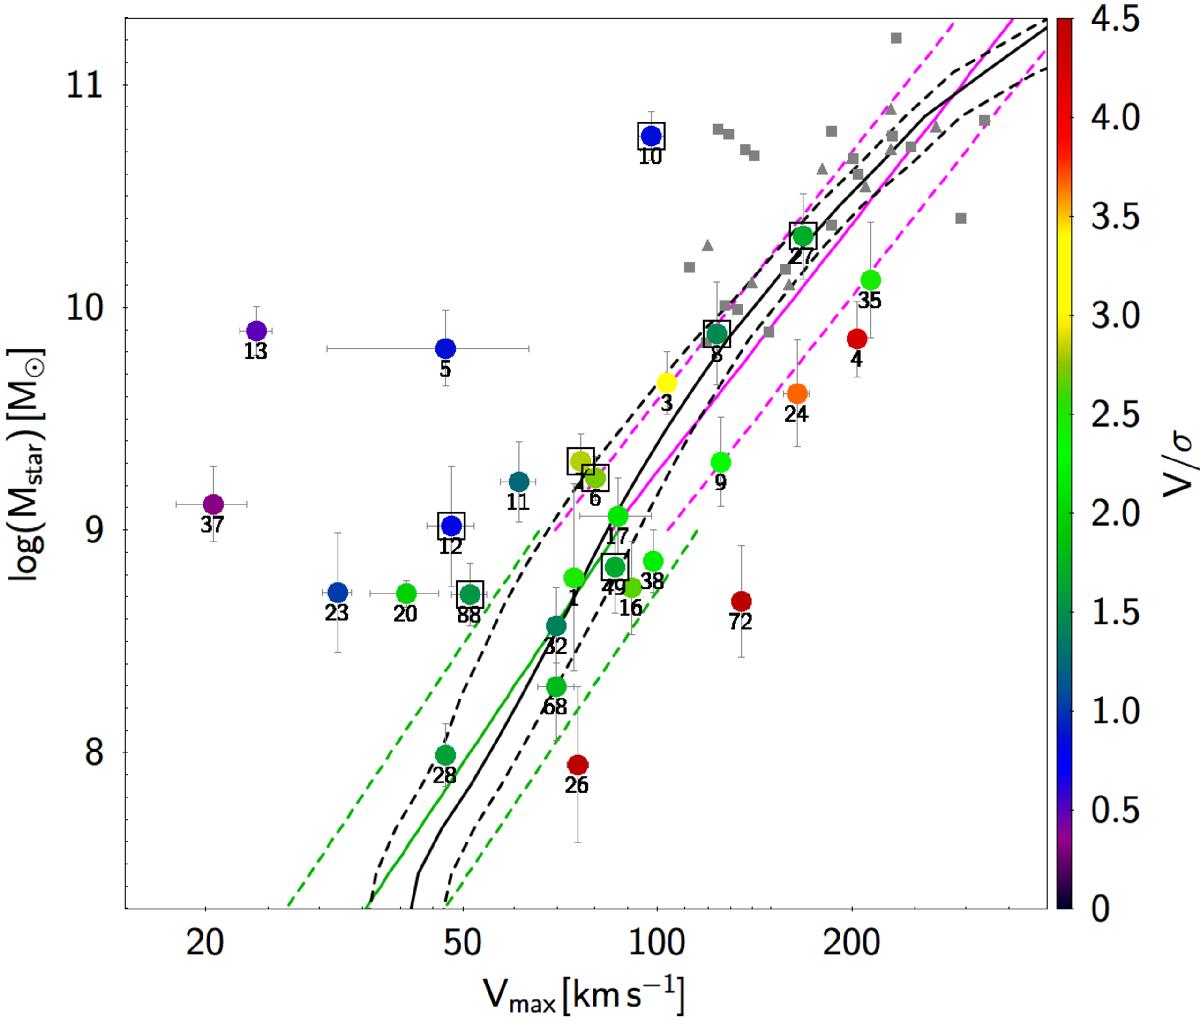
Tully-Fisher relation for the sample of spatially resolved galaxies in the MUSE-HDFS. Labels indicate the galaxy ID. The points are color-coded as a function of the V/σ ratio. Galaxies in close pairs and/or showing signatures of recent gravitational interactions are identified with black squares. Previous IFS samples of (massive) star-forming galaxies in similar redshift ranges: IMAGES (gray triangles; Puech et al. 2010) and MASSIV (gray squares; Epinat et al. 2012) are also shown for comparison. The TFR defined in the high-mass regime (M⋆> 109M⊙) from previous surveys in a similar redshift range (z = 0.2 − 1.4; Miller et al. 2011; Vergani et al. 2012) is shown with a magenta line. The TFR defined in the low-mass regime (M⋆< 109M⊙; Kassin et al. 2007, 2012; Miller et al. 2014; z = 0.2 − 1.0) is shown with a green line. The dotted lines show the dispersion around these relations. A comparison with the predictions from the EAGLE cosmological hydrodynamical simulations for z ≈ 0.1 galaxies (Schaye et al. 2015) is also shown (black line with the dashed lines representing the 16% and 84% percentiles).
Current usage metrics show cumulative count of Article Views (full-text article views including HTML views, PDF and ePub downloads, according to the available data) and Abstracts Views on Vision4Press platform.
Data correspond to usage on the plateform after 2015. The current usage metrics is available 48-96 hours after online publication and is updated daily on week days.
Initial download of the metrics may take a while.