Fig. A.1
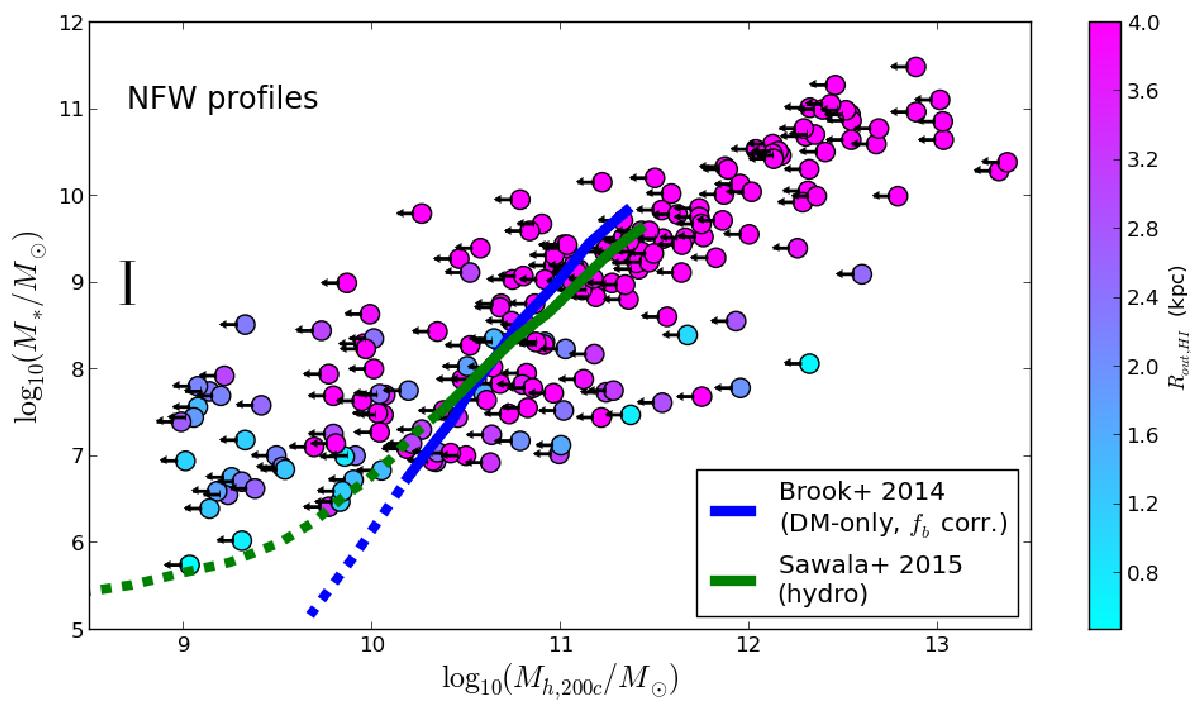
Datapoints represent the position of galaxies in our sample in the M∗ – Mh plane. The x-axis position of each galaxy corresponds to the virial mass of the most massive NFW halo that is compatible with the galactic kinematics measured at the outermost HI point (see Sect. 2.2.2). The y-axis position corresponds to the estimated stellar mass of each object (see Sect. 2.2.1). The datapoints are color-coded based on their outermost HI radius, Rout,HI. The blue and green solid lines represent the AM relations between M∗ and Mh obtained by Brook et al. (2014) and Sawala et al. (2015), respectively. The dashed portions of the lines are extrapolations of the derived relations. A reference errorbar is also plotted, representing the typical uncertainty in the stellar mass estimates for our galaxies (≈0.25 dex). Please refer to Appendix A for a more detailed description of this figure, and for its scientific interpretation.
Current usage metrics show cumulative count of Article Views (full-text article views including HTML views, PDF and ePub downloads, according to the available data) and Abstracts Views on Vision4Press platform.
Data correspond to usage on the plateform after 2015. The current usage metrics is available 48-96 hours after online publication and is updated daily on week days.
Initial download of the metrics may take a while.