Fig. 5
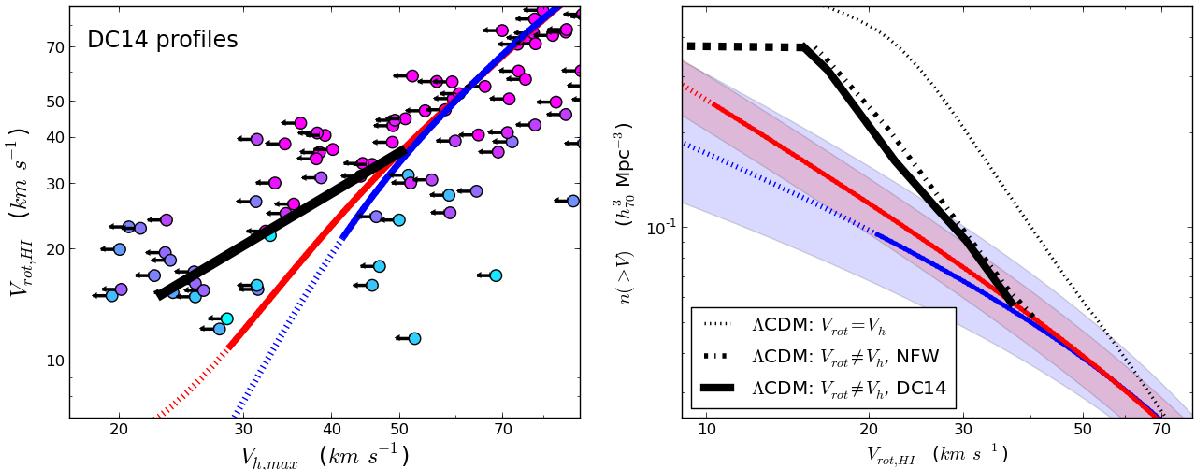
Left panel: similar to the bottom panel of Fig. 4 (error bands omitted for clarity). The thick black line corresponds to our by-eye estimate of the average Vrot,HI – Vh relation implied by the dwarf data, when analyzed with DC14 profiles. Dwarfs with low values of Rout,HI (cyan datapoints) are given low weight in our estimate (see Sect. 2.2.2). The relation stops at Vh,max ≈ 22 km s-1, because we assume that smaller halos do not host galaxies due to cosmic reionization (Sawala et al. 2015). Right panel: similar to the left panel of Fig. 2. The thick black line denotes the cumulative VF of galaxies that results from the average Vrot – Vh relation implied by the dwarfs (i.e., according to the black line in the left panel of this figure). It should be interpreted as a lower limit on the galactic VF that is expected in ΛCDM, after accounting for baryonic effects (see Sect. 4). The dashed portion of the line reflects the abrupt halt in the growth of the galaxy count, that is imposed to mimic the effect of cosmic reionization. For reference, we also show the ΛCDM expectation for the galactic VF when no profile modification by baryons is assumed (black dot-dashed line), and when Vrot,HI = Vh,max is assumed in addition (dotted black line, same as thick dotted line in the left panel of Fig. 2).
Current usage metrics show cumulative count of Article Views (full-text article views including HTML views, PDF and ePub downloads, according to the available data) and Abstracts Views on Vision4Press platform.
Data correspond to usage on the plateform after 2015. The current usage metrics is available 48-96 hours after online publication and is updated daily on week days.
Initial download of the metrics may take a while.