Fig. 4
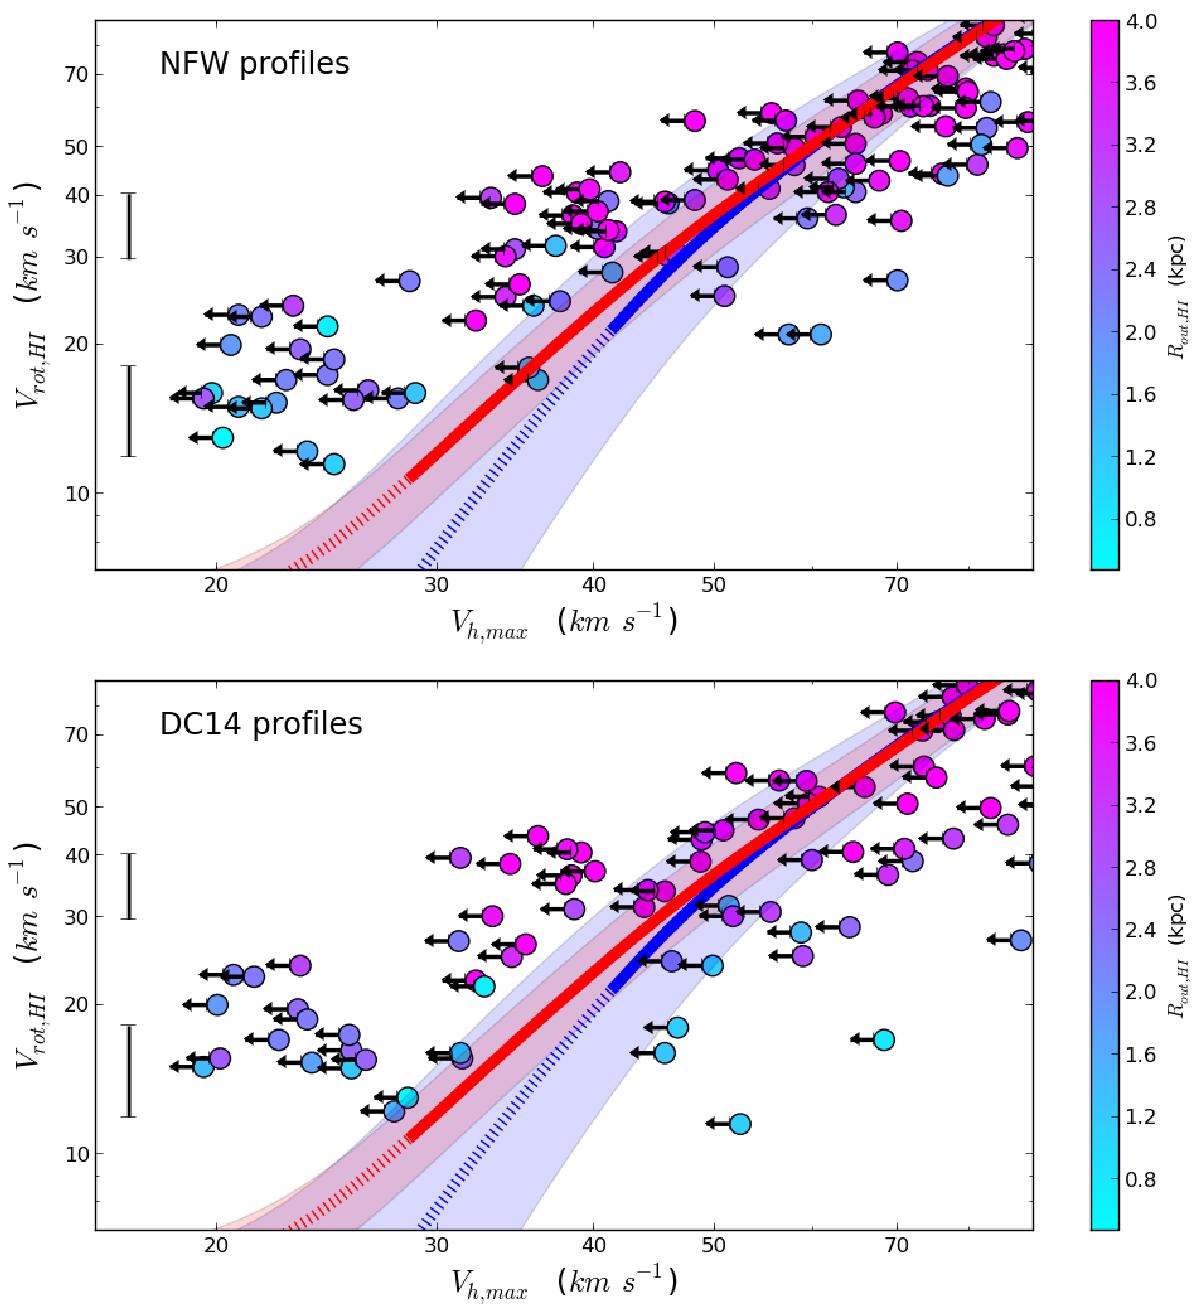
Top panel: datapoints represent the position of our sample of galaxies in the Vh,max – Vrot,HI plane. The y-axis position corresponds to the rotational velocity derived from the inclination-corrected HI linewidth, Vrot,HI. The vertical errorbars represent typical y-axis errors for galaxies with Vrot,HI = 15 km s-1 and 35 km s-1. The x-axis position of each galaxy corresponds instead to the upper limit on the Vh,max of its host halo, inferred from the galactic kinematics measured at the outermost HI radius and assuming an NFW density profile (refer to Sect. 2.2.2). The color-coding represents the radius of the outermost velocity measurement, Rout,HI. The blue and red shaded regions represent the AM relations between Vh,max and Vrot,HI that reproduce the galactic velocity function measured in the ALFALFA survey (this work) and within the Local Volume (Klypin et al. 2015). Bottom panel: same as in the top panel, but galaxies are placed on the x-axis assuming their host halos follow the DC14 density profile. Please refer to Sect. 3 for the scientific interpretation of this figure.
Current usage metrics show cumulative count of Article Views (full-text article views including HTML views, PDF and ePub downloads, according to the available data) and Abstracts Views on Vision4Press platform.
Data correspond to usage on the plateform after 2015. The current usage metrics is available 48-96 hours after online publication and is updated daily on week days.
Initial download of the metrics may take a while.