Fig. 3
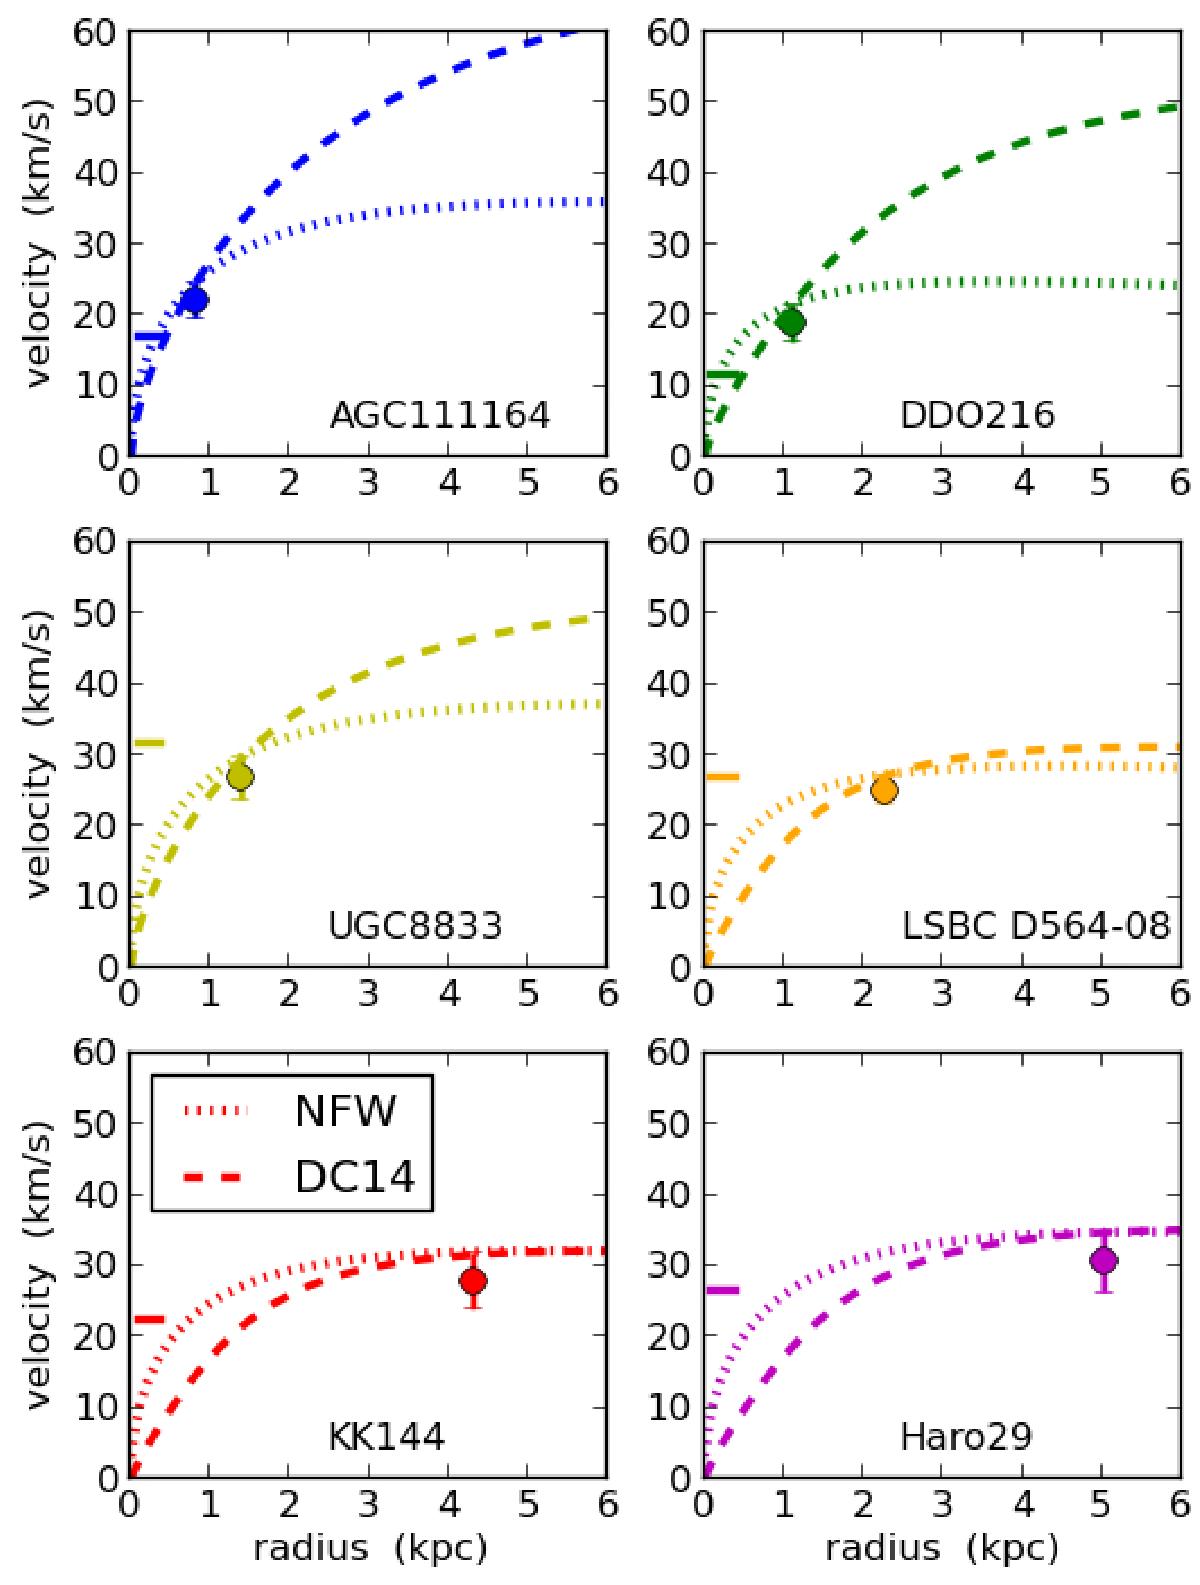
Datapoints with errorbars represent the rotational velocity measured at the outermost HI radius, Vout,HI = V(Rout,HI), for six example galaxies. The galaxies are ordered from top left to bottom right in order of increasing Rout,HI. In each panel, the dotted and dashed lines correspond to the RCs of the most massive halo that is compatible with the observed datapoint within 1σ, assuming an NFW and DC14 profile respectively. The horizontal mark denotes the value of the linewidth-derived Vrot,HI for each galaxy.
Current usage metrics show cumulative count of Article Views (full-text article views including HTML views, PDF and ePub downloads, according to the available data) and Abstracts Views on Vision4Press platform.
Data correspond to usage on the plateform after 2015. The current usage metrics is available 48-96 hours after online publication and is updated daily on week days.
Initial download of the metrics may take a while.