Fig. 2
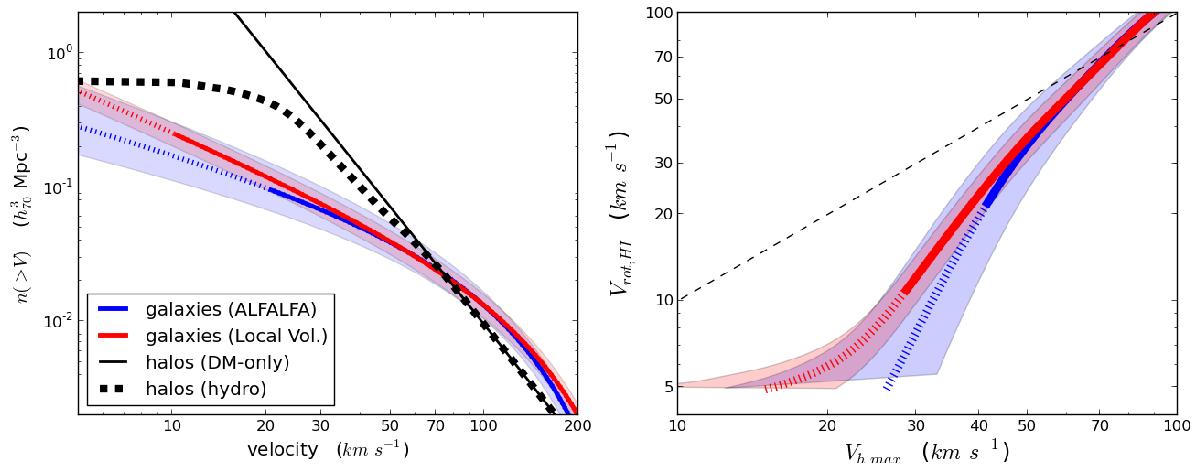
The velocity function (VF) of galaxies and halos, and the Vrot – Vh relation according to abundance matching (AM). left panel: the blue and red lines denote the VF of galaxies according to ALFALFA survey data (this work) and according to data for Local Volume galaxies (Klypin et al. 2015), respectively. These VFs are inferred from the corresponding direct measurements of the galactic WF (see Fig. 1). The solid portions of the lines denote the range of velocities over which each VF is constrained by data, while the dotted portions represent extrapolations. The shaded bands represent estimated errors on each observational measurement. The black lines correspond instead to the VF of halos in a ΛCDM Universe with Planck cosmological parameters. The thin solid line refers to the DM-only result (Klypin et al. 2015), while the thick dashed line includes “baryonic” effects such as baryon depletion and reionization feedback (Sawala et al. 2015). Note that the x-axis corresponds to Vrot,HI in the case of galaxies, and Vh,max in the case of halos. Note also that, unlike in Fig. 1, the distributions are plotted in terms of cumulative number densities. Right panel: the blue and red solid lines are the Vrot – Vh relations that reproduce the galactic VFs measured by ALFALFA and in the Local Volume, respectively. The relations were computed by abundance matching (AM), between each of the two observational VFs and the “baryonic” version of the halo VF. The dotted portions of the lines are based on extrapolations of the galactic VFs. The shaded bands represent the uncertainty introduced by the observational uncertainty in the galactic VFs. The black dashed line is a reference one-to-one line.
Current usage metrics show cumulative count of Article Views (full-text article views including HTML views, PDF and ePub downloads, according to the available data) and Abstracts Views on Vision4Press platform.
Data correspond to usage on the plateform after 2015. The current usage metrics is available 48-96 hours after online publication and is updated daily on week days.
Initial download of the metrics may take a while.