Fig. B.1
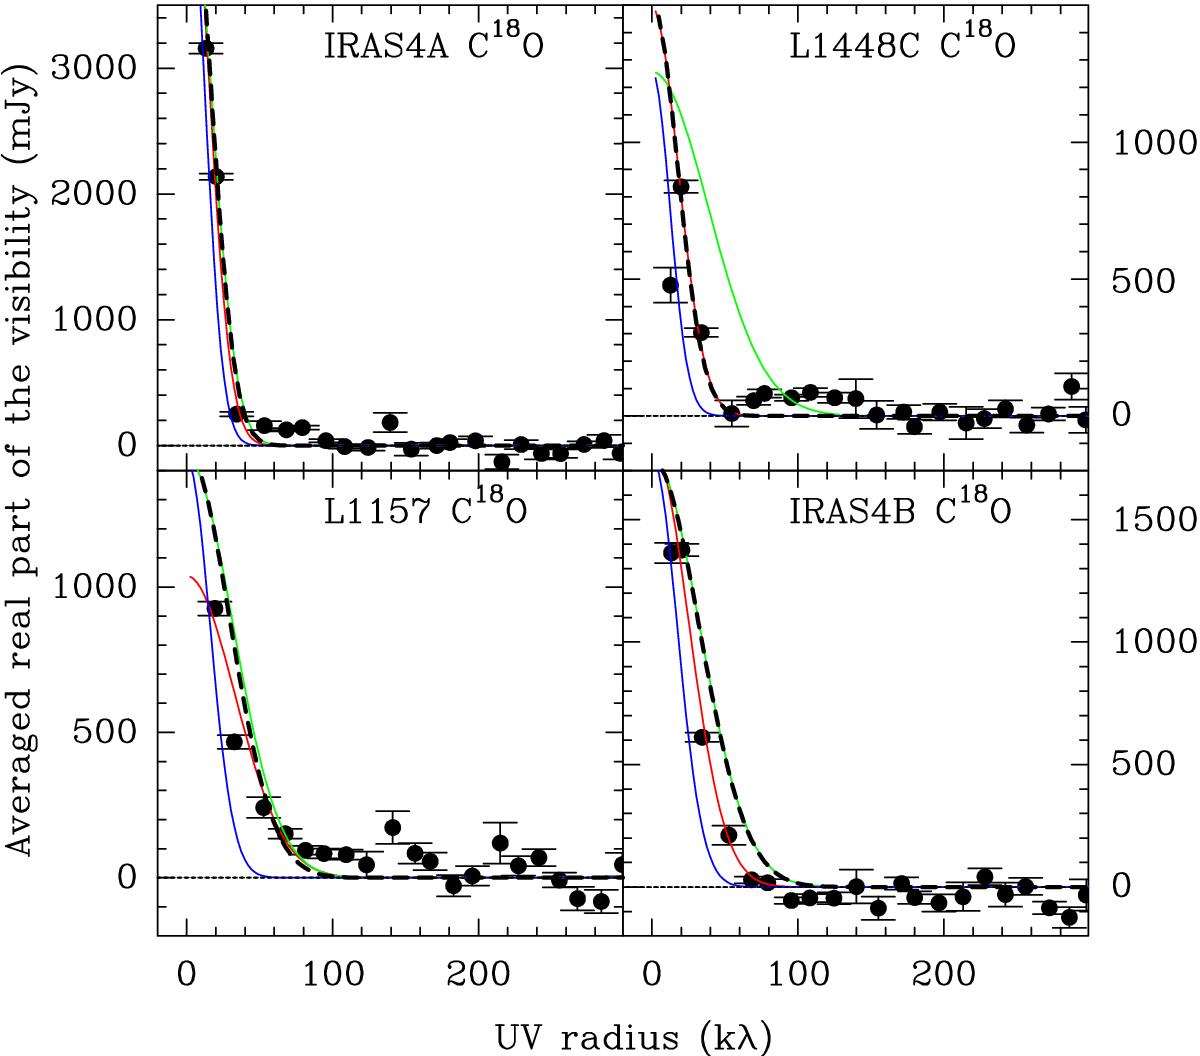
C18O uv plots for IRAS4A (top left), L1448C (top right), L1157 (bottom left) and IRAS4B (bottom right). The data is integrated over ±3 km s-1 around the line center and radially averaged in bins of 20 m with task uv_circle in MAPPING. Red lines show the results of the circular Gaussian fits to the un-averaged uv data, while the blue and green lines show the results of the elliptical Gaussian fits to the un-averaged uv data along the major and minor axes, respectively. Black dashed lines show the result of the elliptical Gaussian fits with fixed PA along the outflow. The parameters of the fits are listed in Table 3.
Current usage metrics show cumulative count of Article Views (full-text article views including HTML views, PDF and ePub downloads, according to the available data) and Abstracts Views on Vision4Press platform.
Data correspond to usage on the plateform after 2015. The current usage metrics is available 48-96 hours after online publication and is updated daily on week days.
Initial download of the metrics may take a while.