Fig. A.1
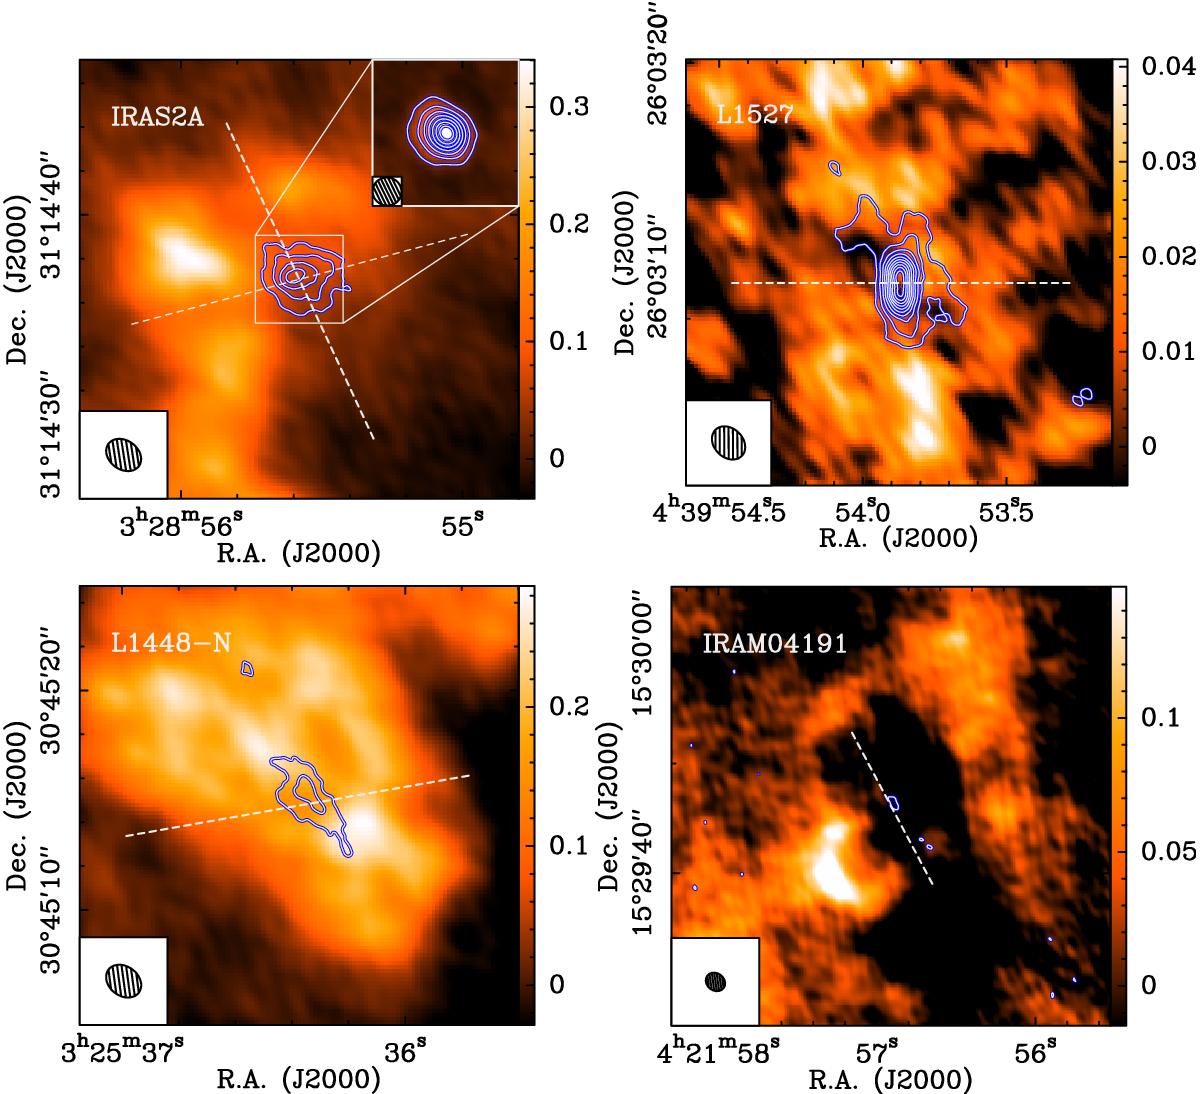
N2H+ and C18O integrated intensity maps for IRAS2A (top left), L1527 (top right), L1448-N (bottom left), and IRAM04191 (bottom right) as prototypical sources for the four morphology classes we find in the full sample of sources. Color background: N2H+ (1–0) emission integrated over all seven hyperfine components. The noise in these maps is σ = (0.043, 0.012, 0.033, 0.032) Jy beam-1 km s-1 for IRAS2A, L1527, L1448-N, and IRAM04191, respectively. The wedges show the N2H+ intensity scale in Jy beam-1 km s-1. Note that while for the first three sources the FOV is 20′′× 20′′, it is 40′′× 40′′ for IRAM04191 to show the full ring-like morphology. Contours show integrated emission of C18O (2–1) in steps of 3σ, starting at 3σ up to 60σ, with σ = (0.037, 0.022, 0.038, 0.018) Jy beam-1 km s-1 for IRAS2A, L1527, L1448-N, and IRAM04191, respectively. The C18O emission was integrated over ±3 km s-1 around the systemic velocity of each source. The inlay in the upper right corners of the top left panel shows the methanol emission towards IRAS2A as color background and contours in steps of 3σ, starting at 3σ up to 60σ inside the central 2′′. The filled ellipses in the lower left corner of the panels indicate the synthesized beam sizes of the N2H+ observations at 3 mm. The dashed white lines illustrate the small-scale outflow directions (See Codella et al. 2014; Hogerheijde et al. 1998; Podio et al. in prep.; Belloche et al. 2002).
Current usage metrics show cumulative count of Article Views (full-text article views including HTML views, PDF and ePub downloads, according to the available data) and Abstracts Views on Vision4Press platform.
Data correspond to usage on the plateform after 2015. The current usage metrics is available 48-96 hours after online publication and is updated daily on week days.
Initial download of the metrics may take a while.