Fig. C.1
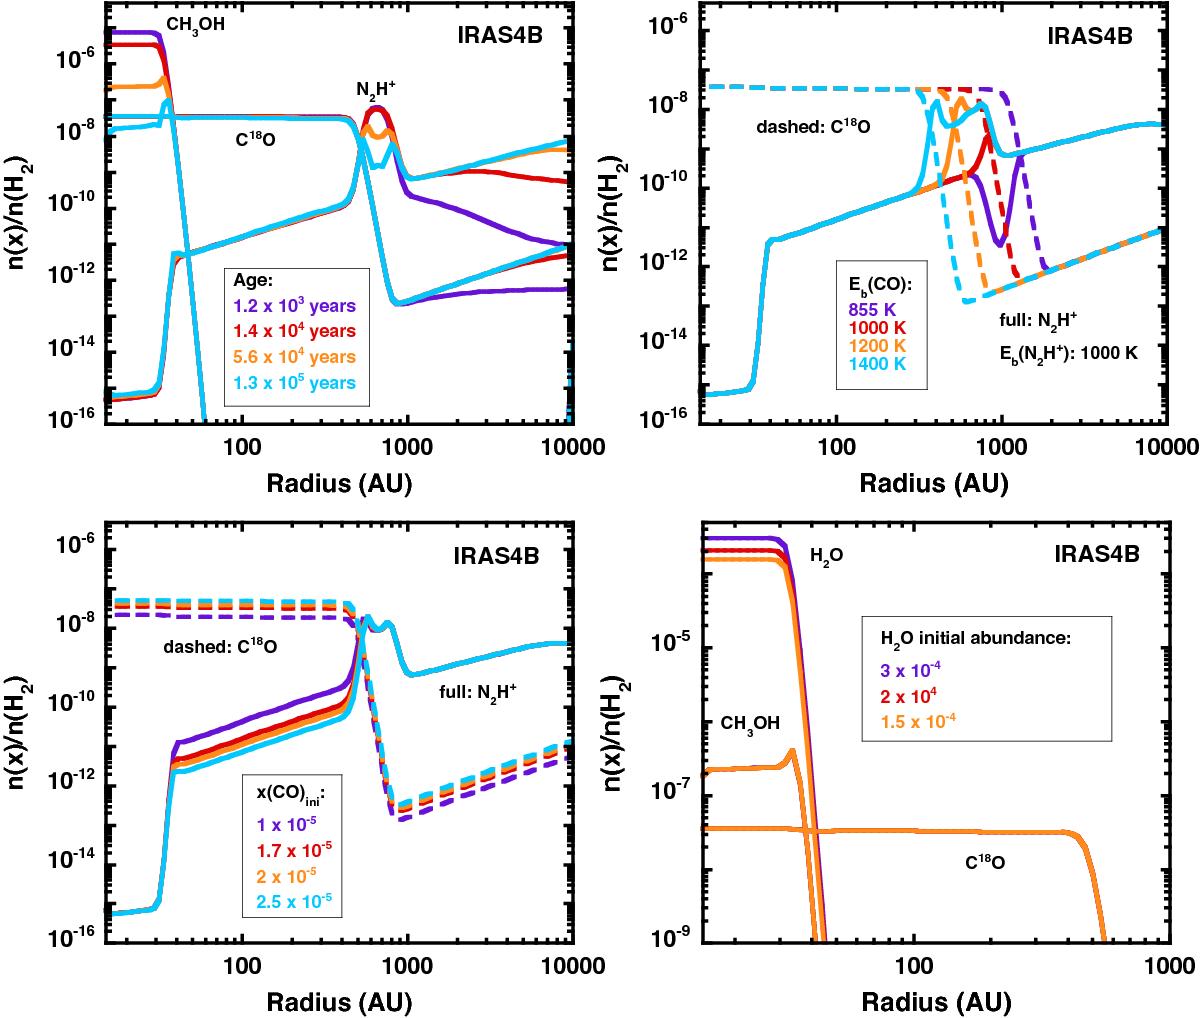
Dependences of the chemical model on various free parameters. Top left: the fractional abundances of CH3OH, C18O, and N2H+ are shown for four different chemical ages. Same colors identify abundance curves at the same chemical time for chemical ages as indicated in the legend. Top right: the fractional abundances of C18O (dashed lines) and N2H+ (full lines) are displayed for different values of the CO binding energy. Same colors identify abundance curves computed with the same CO binding energy as indicated in the legend. Bottom left: the fractional abundances of C18O (dashed lines) and N2H+ (full lines) are displayed for different values of the initial fractional CO abundance. Same colors identify abundance curves computed with the same CO initial abundance as indicated in the legend. Bottom right: the fractional abundances of H2O, CH3OH, and C18O are shown for four different values of the initial fractional H2O abundance. Same colors identify abundance curves computed with the same H2O initial abundance as indicated in the legend.
Current usage metrics show cumulative count of Article Views (full-text article views including HTML views, PDF and ePub downloads, according to the available data) and Abstracts Views on Vision4Press platform.
Data correspond to usage on the plateform after 2015. The current usage metrics is available 48-96 hours after online publication and is updated daily on week days.
Initial download of the metrics may take a while.