Fig. 1
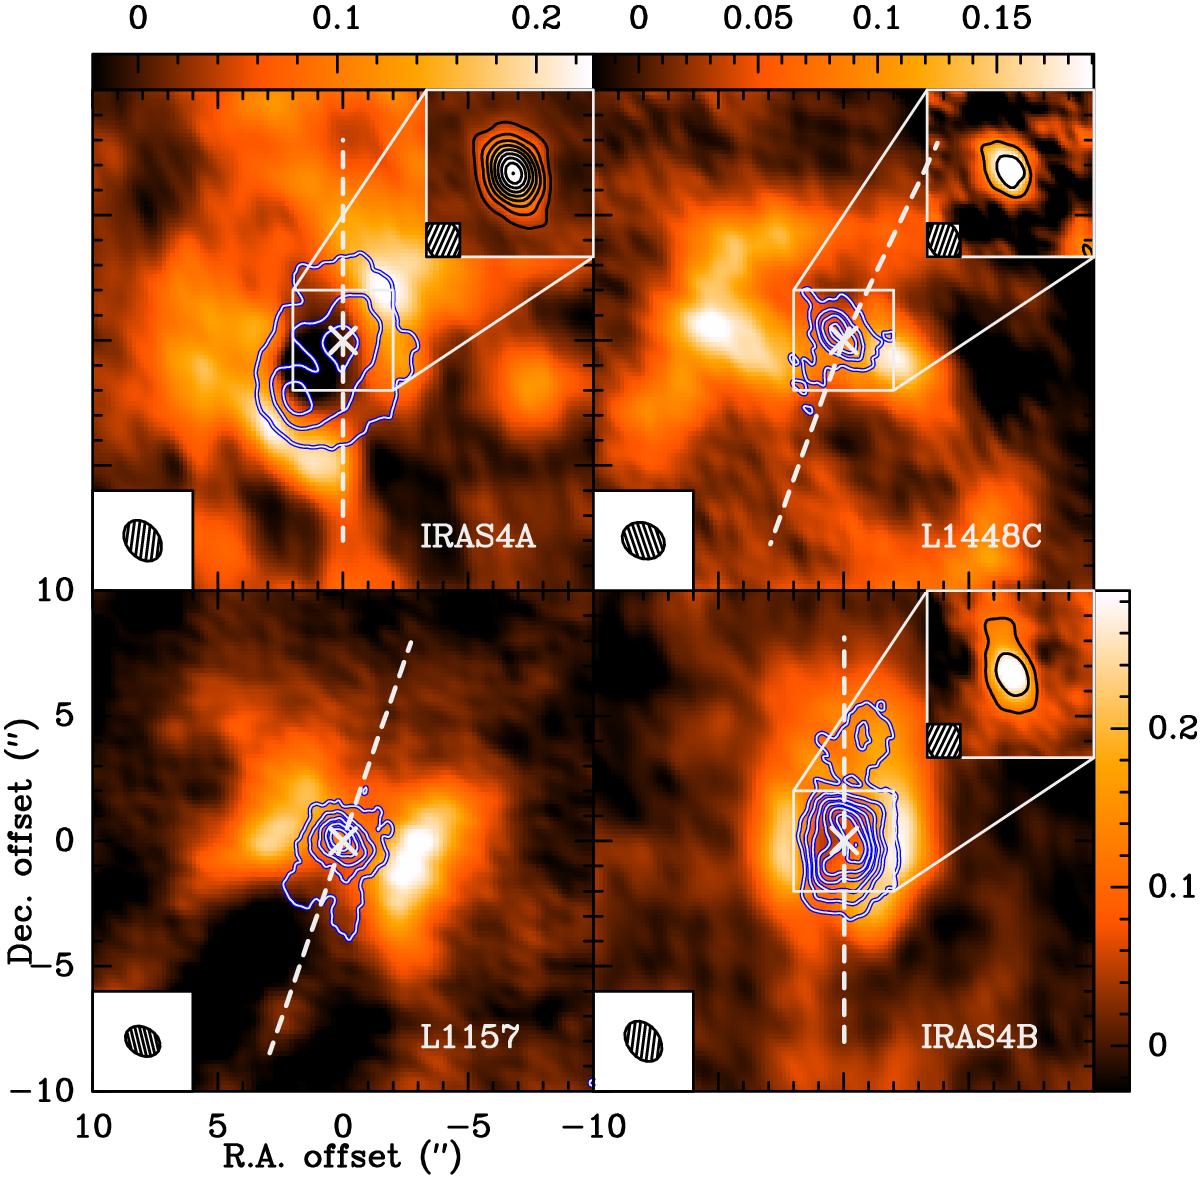
Anticorrelation between N2H+ and C18O. Color background: N2H+ (1–0) emission integrated over all seven hyperfine components. The noise in these maps is σ = (0.030, 0.027, 0.025, 0.029) Jy beam-1 km s-1 for IRAS4A, L1448C, L1157, and IRAS4B, respectively. The wedges show the N2H+ intensity scale in Jy beam-1 km s-1. For the two lower panels the scaling is the same. Contours show emission of C18O (2–1) in steps of 6σ (IRAS4A) or 3σ (L1448C, L1157, and IRAS4B), starting at 3σ, with σ = (0.044, 0.029, 0.031, 0.033) Jy beam-1 km s-1 for IRAS4A, L1448C, L1157, and IRAS4B, respectively. The inlays in the upper right corners show the methanol emission as color background and contours in steps of 3σ, starting at 3σ inside the central 2′′, with σ = (0.028, 0.019, 0.027) Jy beam-1 km s-1 for IRAS4A, L1448C, and IRAS4B. In L1157, the methanol line has not been detected at a 3σ level. The filled ellipses in the lower left corner of the panels indicate the synthesized beam sizes of the N2H+ observations at 3 mm. The dashed white lines illustrate the small-scale outflow directions (see Table 3 and Sect. 3.1), and the white crosses show the positions of the sources as listed in Table 1.
Current usage metrics show cumulative count of Article Views (full-text article views including HTML views, PDF and ePub downloads, according to the available data) and Abstracts Views on Vision4Press platform.
Data correspond to usage on the plateform after 2015. The current usage metrics is available 48-96 hours after online publication and is updated daily on week days.
Initial download of the metrics may take a while.